
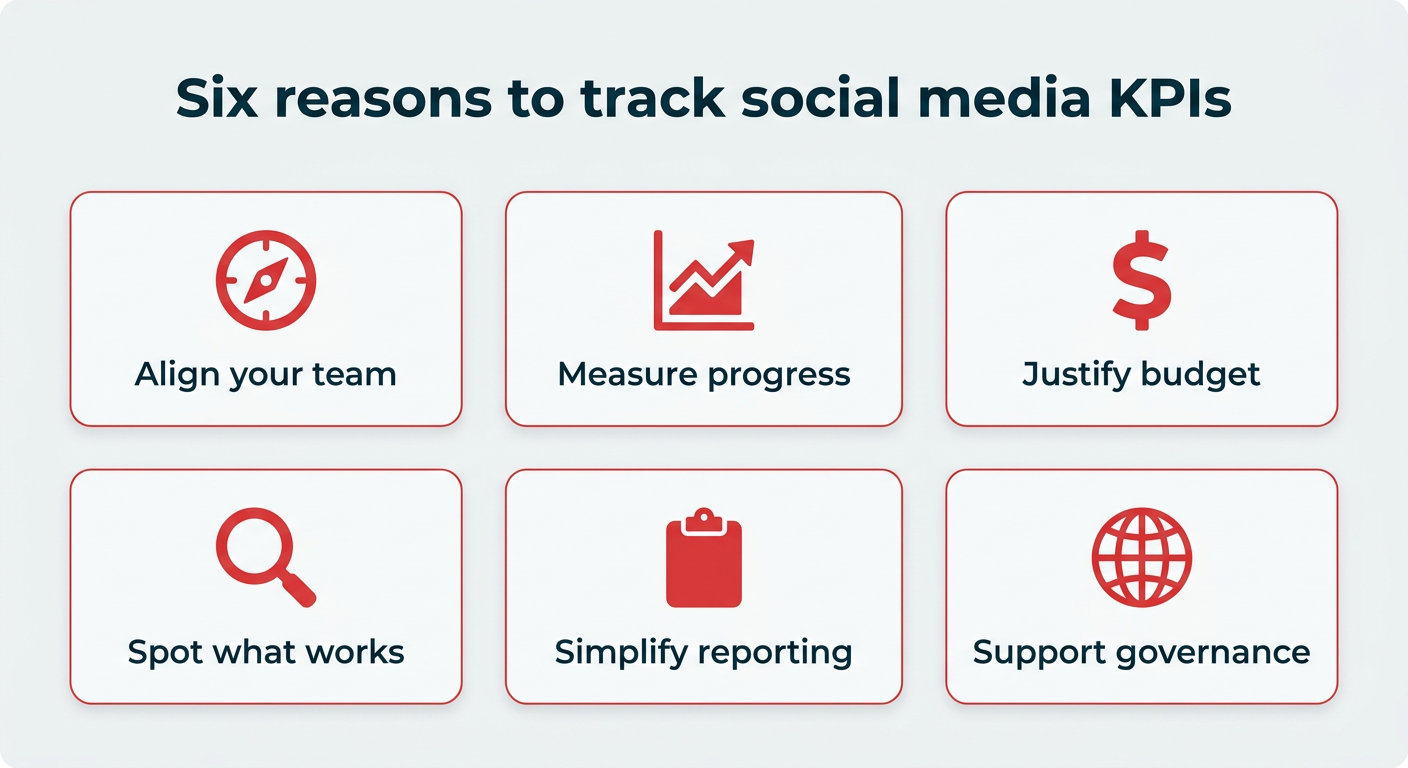
In the rapidly evolving digital landscape of 2026, where social media advertising spend is projected to exceed $121 billion in the United States alone, the margin for error has narrowed significantly. For marketing professionals, the ability to move beyond "vanity metrics" and demonstrate clear, quantifiable business impact is no longer optional—it is the prerequisite for securing budget, headcount, and executive buy-in.
Setting "Smart" Key Performance Indicators (KPIs) is the bridge between creative output and strategic growth. By focusing on metrics that correlate directly to business outcomes, teams can transform their social channels from simple broadcasting tools into high-performing engines for revenue and customer retention.

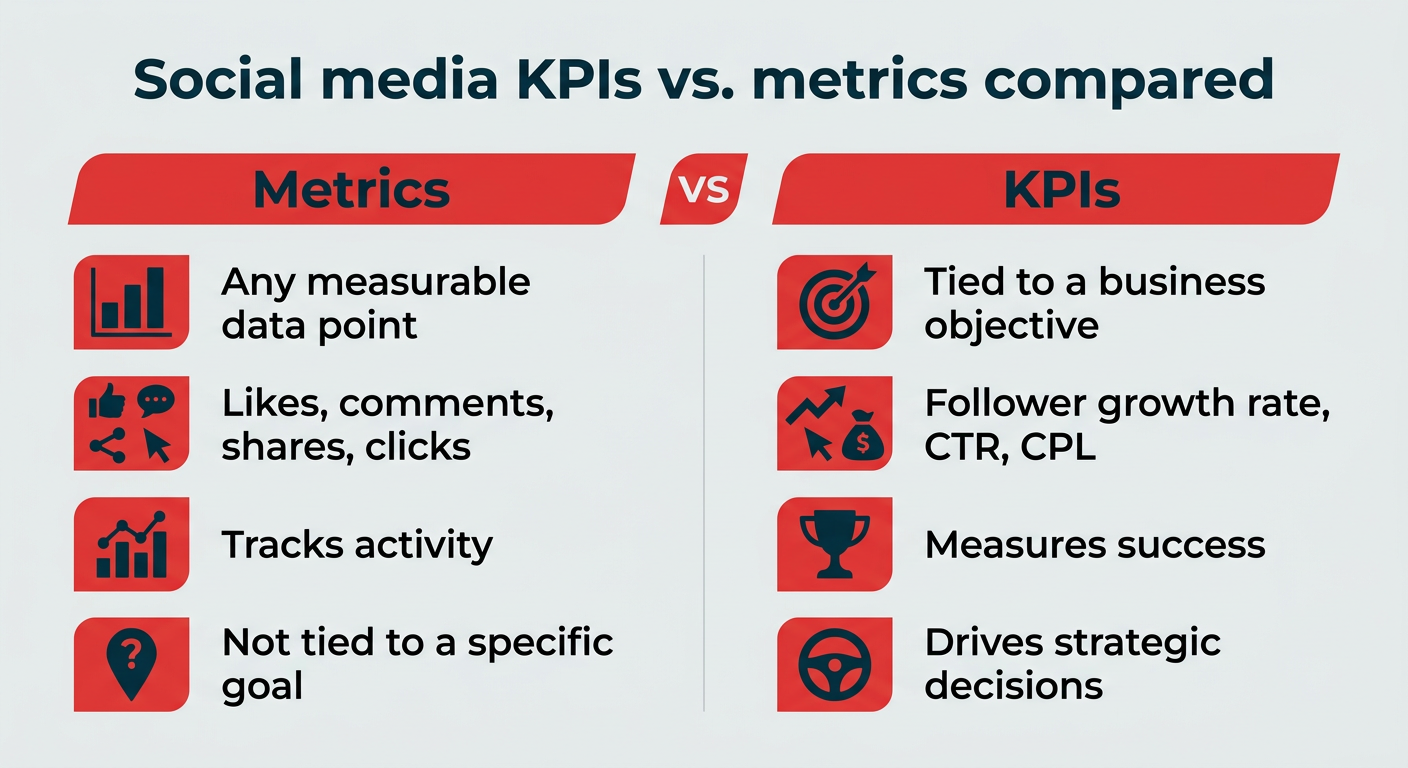
The Strategic Foundation: KPIs vs. Metrics
The most common mistake in digital marketing is treating all data as equal. A metric is any data point you can track—impressions, likes, or video views. A KPI, however, is a strategic metric. It is a specific data point that signals whether your organization is meeting its overarching business objectives.
The Golden Rule: All KPIs are metrics, but not all metrics are KPIs.

For instance, if your company’s objective is to build brand awareness, "follower growth rate" serves as a valid KPI because it indicates an expanding footprint. If your goal is customer retention, "average response time" becomes your primary KPI. By isolating the 3–5 metrics that genuinely impact your bottom line, you prevent "data paralysis" and ensure your team’s daily efforts remain aligned with the company’s broader mission.
Chronology of Strategy: From Setup to Optimization
To implement a successful KPI framework, marketers must follow a disciplined, phased approach:
- Objective Alignment (Phase 1): Define the business goals. Are you prioritizing lead generation, brand sentiment, or direct sales?
- Baseline Establishment (Phase 2): Use internal historical data or industry benchmarks to understand your current standing. Without a "before" snapshot, you cannot measure progress.
- Target Setting (Phase 3): Utilize the SMART framework (Specific, Measurable, Achievable, Relevant, Time-bound).
- Continuous Monitoring (Phase 4): Review performance weekly for tactical pivots and monthly for strategic shifts.
- Refinement (Phase 5): Optimize based on what the data reveals about content performance, platform efficacy, and audience behavior.
Supporting Data: The Six Pillars of Performance
In 2026, effective social media measurement is categorized into six distinct pillars, each serving a unique function in the sales funnel.
1. Engagement KPIs
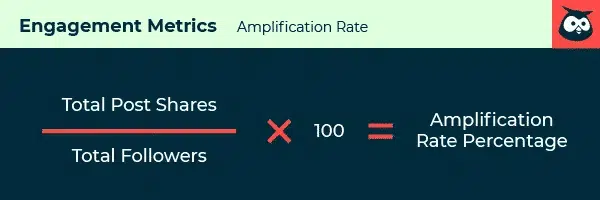
These measure the depth of your audience’s relationship with your brand. Key metrics include Likes, Comments, Shares, Saves, and Average Engagement Rate. A high engagement rate indicates that your content is not just being seen, but is actively resonating with your target demographic.
2. Awareness KPIs
These metrics focus on reach and visibility. Impressions measure how many times content appeared on a screen, while Reach tracks the unique individuals who viewed it. Follower growth rate is the critical metric here; it tells you if your brand is becoming a more significant authority in the digital space.
3. Conversion KPIs
This is where social media proves its worth to the CFO. Click-through Rate (CTR), Conversion Rate, and Bounce Rate provide a clear view of how social traffic performs once it arrives at your landing pages. Cost Per Click (CPC) and Cost Per Mille (CPM) allow for rigorous budget management.
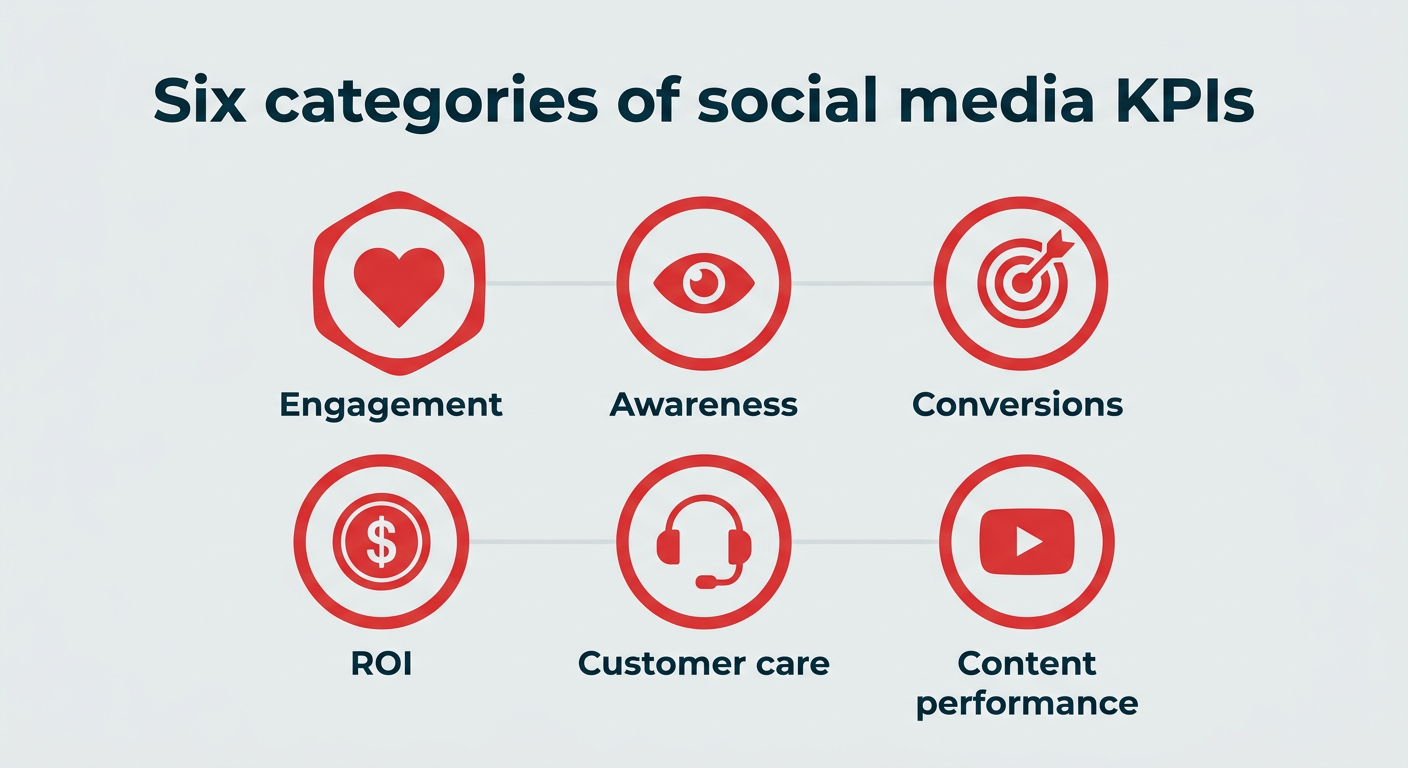
4. ROI KPIs
To justify investment, you must track Earned Media Value (EMV)—the monetary value of organic exposure—as well as Cost Per Lead (CPL) and Cost Per Acquisition (CPA). These figures prove that your social strategy is not just generating "noise," but contributing to the pipeline.
5. Customer Care KPIs
Social media is the modern storefront for customer service. Monitoring Net Promoter Score (NPS), Customer Satisfaction (CSAT), Average Response Time, and First Contact Resolution Rate ensures that the brand reputation you build online is supported by stellar service.

6. Content Performance KPIs
This pillar evaluates the "what." By tracking Video Views, Watch Time, and Completion Rates, brands can identify which content formats (e.g., short-form video vs. long-form thought leadership) yield the best return on production time.
The Role of Industry Benchmarks
Data in a vacuum is misleading. To understand if a 2% engagement rate is "good," you must compare it against your specific industry standards. Tools like Hootsuite’s benchmarking allow brands to compare their performance against competitors. If your engagement is lower than the industry average, it is a signal to pivot your content strategy; if it is higher, it is a signal to increase investment in that specific format.

| Business Goal | Primary KPI | Example SMART Target |
|---|---|---|
| Brand Awareness | Audience Growth Rate | +10% followers in 90 days |
| Audience Engagement | Avg. Engagement Rate | Increase rate from 2% to 3% by Q3 |
| Website Traffic | Click-Through Rate | 1.5% CTR on all links within 8 weeks |
| Prove ROI | Cost Per Lead (CPL) | Reduce CPL from $25 to $18 by quarter-end |
| Customer Satisfaction | Avg. Response Time | Under 2 hours within 60 days |
Implications for Future Strategy
As we look toward the latter half of the decade, the integration of AI-driven analytics will change how we view KPIs. Predictive modeling will soon allow marketers to forecast the impact of a campaign before it launches. However, the human element—the ability to interpret these KPIs and translate them into brand-building narratives—remains the most valuable skill in a social media manager’s toolkit.
The primary implication for modern brands is the shift toward accountability. CMOs are under increasing pressure to justify every dollar spent. By mastering the KPIs listed above, marketing teams can pivot from being viewed as a "cost center" to being recognized as a "revenue driver."
Frequently Asked Questions (FAQ)
How many KPIs should I track?
Limit yourself to 3–5 core KPIs per objective. Tracking too many leads to "data fatigue" and prevents you from taking decisive action.
What is the difference between a KPI and a vanity metric?
A vanity metric looks good on paper (e.g., total likes) but doesn’t necessarily drive business results. A KPI is directly tied to a business goal, such as conversion rate or lead generation.

How often should I review these numbers?
Weekly reviews are essential for tactical adjustments (e.g., tweaking an ad headline), while monthly reviews are necessary for long-term strategic evaluation.
Can I track these without expensive software?
While native platform analytics (Facebook Insights, LinkedIn Analytics, etc.) are free, they lack the cross-platform integration required for a holistic view. Professional dashboard tools are recommended for teams managing multiple channels.
What should I do if my KPIs aren’t improving?
Do not panic. Audit your content to see if it aligns with your audience’s needs, verify your tracking links are working correctly, and ensure your benchmarks are realistic. If the data still shows a decline, it may be time to rethink your messaging strategy or audience targeting.
Conclusion
Setting social media KPIs is not a bureaucratic exercise; it is the ultimate act of creative discipline. By anchoring your strategy in data, you ensure that every post, video, and comment serves the long-term health and growth of your business. As the digital landscape continues to evolve, the brands that win will be those that measure what matters, learn from the results, and iterate with confidence.