


In the rapidly evolving landscape of digital marketing, the ability to translate social media activity into tangible business outcomes has shifted from a "nice-to-have" skill to a foundational pillar of executive strategy. As we look toward 2026, where revenue growth remains the primary mandate for CMOs globally, the distinction between "vanity metrics"—those that look impressive on a slide deck but provide little business utility—and performance-driven data has never been more critical.
The Strategic Imperative: Beyond Vanity Metrics
Social media metrics are the vital signs of your digital presence. They offer a window into how audiences discover, interact with, and convert via your brand’s content. However, a common pitfall for many marketing teams is the conflation of metrics with Key Performance Indicators (KPIs).

To clarify: a metric is a measurement of what happened (e.g., 500 likes, 10,000 impressions). A KPI is the strategic objective that those metrics serve (e.g., "Increase qualified leads from Instagram by 15% this quarter"). Metrics are the building blocks; KPIs are the architecture of your business success.
Strategic planning in 2026 requires a disciplined approach to measurement. The "70/20/10 rule" remains a gold-standard framework for balancing this output: 70% of content should deliver direct value to the audience, 20% should curate insights from external sources, and 10% should be overtly promotional. Your measurement strategy must mirror this split, prioritizing engagement for value-driven posts and conversion data for promotional ones.

The Chronology of Measurement: From Awareness to ROI
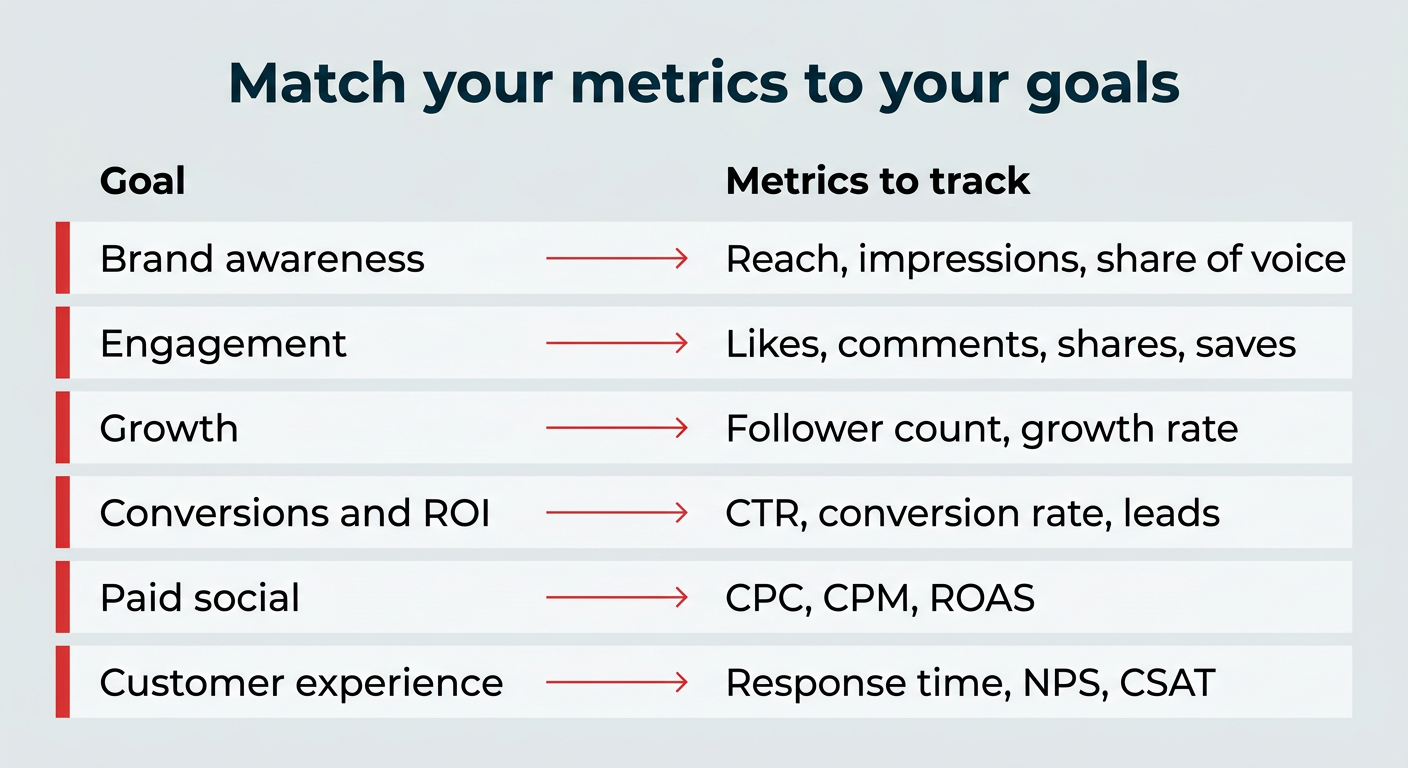
Effective social media reporting follows the customer journey. By aligning your data collection with specific goals, you can build a reporting structure that speaks the language of the C-suite:
- Awareness (The Entry Point): Tracking Reach, Impressions, and Share of Voice (SSoV) to gauge market presence.
- Engagement (The Connection): Monitoring likes, comments, shares, and saves to determine content resonance.
- Growth (The Expansion): Tracking follower count and growth rates to measure brand momentum.
- Conversion (The Action): Utilizing Click-Through Rates (CTR), lead generation, and download metrics to bridge the gap between social and sales.
- Efficiency (The Bottom Line): Calculating Cost Per Click (CPC), Cost Per Thousand Impressions (CPM), and Return on Ad Spend (ROAS) to justify marketing budgets.
Supporting Data: Understanding Platform Nuances
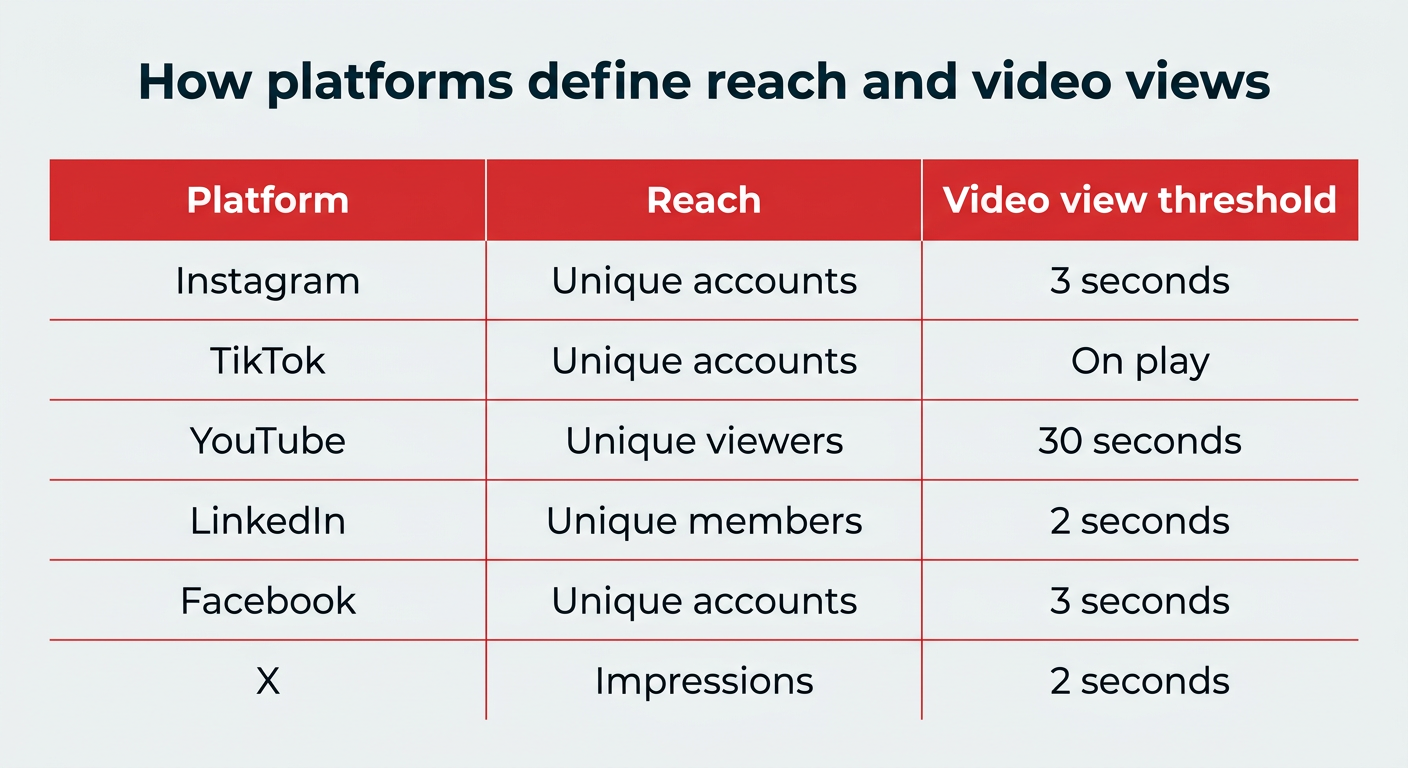
One of the most significant challenges for social media managers in 2026 is the lack of standardized definitions across platforms. A "view" on YouTube is fundamentally different from a "view" on TikTok.
- Instagram & Facebook: A view is typically counted after 3 seconds of engagement.
- YouTube: A view requires at least 30 seconds of watch time.
- LinkedIn: A view requires 2 seconds with 50% of the video in view.
- TikTok: A view is counted as soon as the video begins playing.
If you attempt to compare raw numbers across these channels without normalizing for these definitions, your data integrity will suffer. Always confirm how your reporting tools define these parameters before presenting benchmarks.
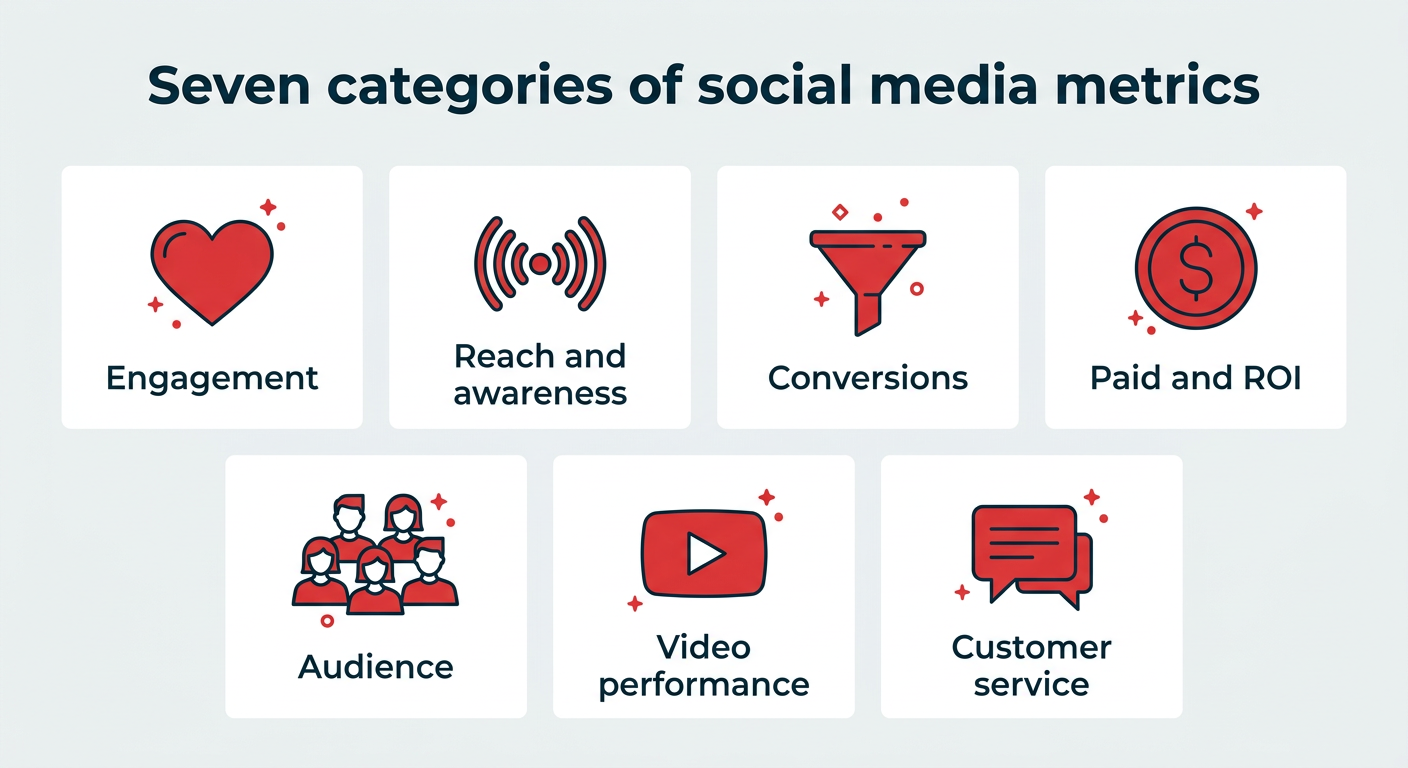
Deep Dive: The 25 Key Metrics You Need to Track
I. Engagement Metrics
Engagement is the currency of the algorithm. It signals to platforms that your content is worth promoting.
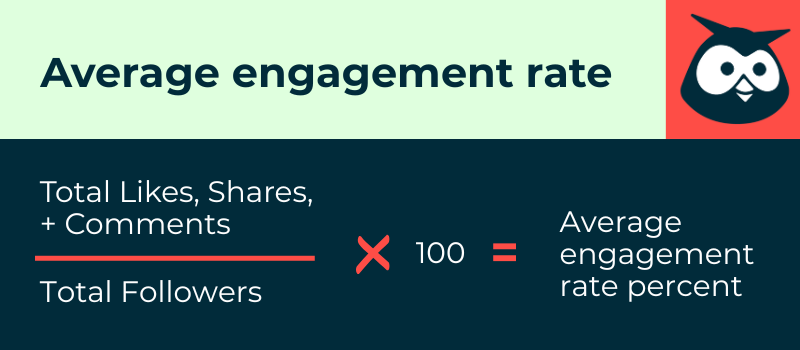
- Engagement Rate: The gold standard for measuring resonance. Formula: (Likes + Comments + Shares + Saves) / Total Followers 100*.
- Saves: High-intent signals that suggest your content is a resource, not just a momentary distraction.
- Comments: The most qualitative engagement signal, providing a direct feedback loop from your customer base.
II. Reach and Awareness
- Social Share of Voice (SSoV): A critical competitive metric. By dividing your brand mentions by the total industry mentions (yours + competitors), you can identify your actual market footprint.
- Social Search Visibility: With Gen Z increasingly using TikTok and Instagram as search engines, tracking your keyword rankings within these platforms is now as important as traditional SEO.
III. Conversion and Paid Social
- Conversion Rate: The ultimate test of your funnel’s efficacy. To navigate the post-cookie landscape of 2026, rely on UTM parameters to trace the path from a social post to a website conversion.
- ROAS (Return on Ad Spend): This is the "North Star" for paid social. If you aren’t calculating (Revenue from ads / Ad spend), you are flying blind.
IV. Audience and Sentiment
- Follower Growth Rate: A measure of momentum. A steady growth rate indicates that your brand is gaining relevance.
- Social Sentiment: Through advanced sentiment analysis tools, brands can now categorize comments and mentions as positive, negative, or neutral. This is essential for reputation management.
V. Video and Customer Service
- Video Completion Rate: A better metric than total views, as it reveals the retention power of your storytelling.
- Average Response Time: In an era of instant gratification, your ability to provide support via DMs or comments impacts brand loyalty.
- NPS (Net Promoter Score): Used to gauge customer loyalty by asking the definitive question: "How likely are you to recommend us to a friend?"
Official Perspectives: The Expert View
Industry leaders, such as former Hootsuite Social Media Manager Trish Riswick, emphasize that the comment section is perhaps the most underrated source of data. "The comment section is filled with inspiration and feedback," Riswick notes. "It demonstrates the effectiveness of your posts and an increase in authentic connection with your followers."
Furthermore, as ad spending on social networks continues to capture nearly a third of all U.S. digital advertising budgets, the pressure to prove ROI has reached an all-time high. CFOs and CEOs are no longer satisfied with "vanity" numbers; they require clear attribution models that show how social media dollars contribute directly to the bottom line.
Implications for 2026 and Beyond
What do these metrics mean for your day-to-day operations?
- Iterate or Abandon: If a post performs well, analyze why. If it flops, cut your losses and pivot.
- Benchmark Against Yourself: Don’t just look at industry averages; look at your own historical performance to see if you are improving month-over-month.
- Cross-Functional Reporting: Share these metrics with Sales, Product, and Support teams. Social data is a goldmine for product development and customer experience improvements.
- Audit Your Tools: Ensure your analytics stack (e.g., Hootsuite, Meta Business Suite, or native platform dashboards) is providing clean, actionable data.
- Close the Feedback Loop: Your social strategy is a living document. Every report should inform the next round of creative experiments.
Conclusion
The transition from 2025 to 2026 marks a turning point where data literacy becomes the most valuable asset in a marketer’s toolkit. By focusing on the metrics that drive business goals—rather than those that simply look good on a dashboard—brands can navigate the complexities of modern social media with confidence.
Whether you are tracking the efficacy of a paid video campaign or analyzing the sentiment of your customer support interactions, remember that every number tells a story. Your job is to ensure that story reflects growth, efficiency, and a deep, data-backed understanding of your audience. As the digital landscape continues to fragment, those who master the art of measurement will be the ones who define the future of the industry.