


In the hyper-competitive landscape of modern digital marketing, vanity metrics like raw follower counts are rapidly losing their luster. For brands, agencies, and individual creators alike, the true measure of success has shifted toward a more qualitative and actionable indicator: the Engagement Rate. As social media algorithms become increasingly sophisticated, prioritizing meaningful interactions over passive views, understanding—and optimizing—your engagement rate is no longer optional; it is the cornerstone of a sustainable digital strategy.

Main Facts: What Is Engagement Rate and Why Does It Matter?
At its core, the engagement rate is a performance metric that quantifies how actively an audience interacts with content. While definitions can fluctuate slightly depending on the platform, it is generally calculated as the total number of interactions—such as likes, comments, shares, saves, poll responses, and link clicks—divided by a specific baseline, such as reach, impressions, or total followers.

Engagement rate matters for three primary reasons:
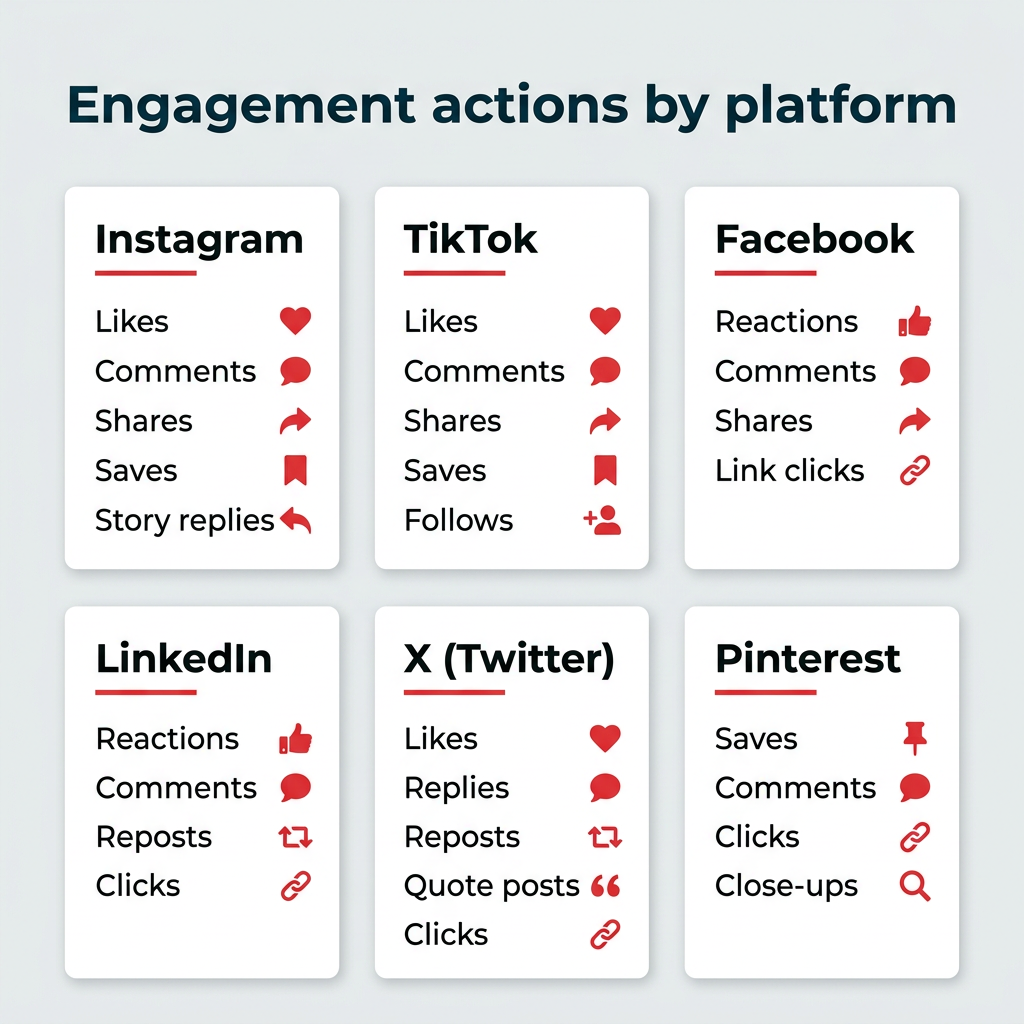
- Validation of Content Resonance: High engagement acts as a barometer for content quality. When users take the time to comment, share, or save a post, they are signaling that the content provided genuine value, entertainment, or relevance.
- Algorithmic Favorability: Social media algorithms are designed to keep users on their respective platforms. By surfacing content that receives early, high-volume engagement, these platforms treat your posts as "preferred" content, often pushing them to wider audiences and new demographics.
- Trust and ROI: For enterprise-level organizations, engagement is a tangible proxy for brand loyalty. An active comment section transforms a static brand page into a community, which serves as a powerful conversion tool and a clear indicator of Return on Investment (ROI) for leadership teams.
Chronology: The Evolution of Measurement
The obsession with engagement has tracked the evolution of social media itself. In the early 2010s, "Likes" were the primary currency of the web. As platforms matured, the depth of interaction became more critical. By 2020, the rise of "Save" and "Share" functions introduced a new layer of intent, indicating that users were moving beyond mindless scrolling toward active curation.
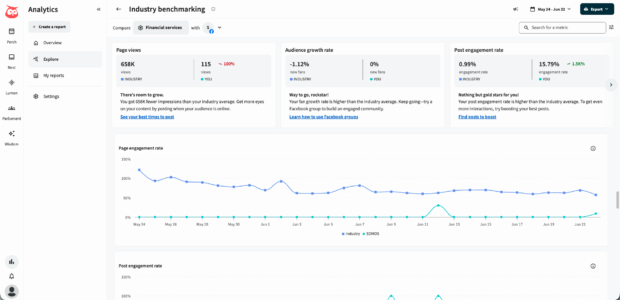
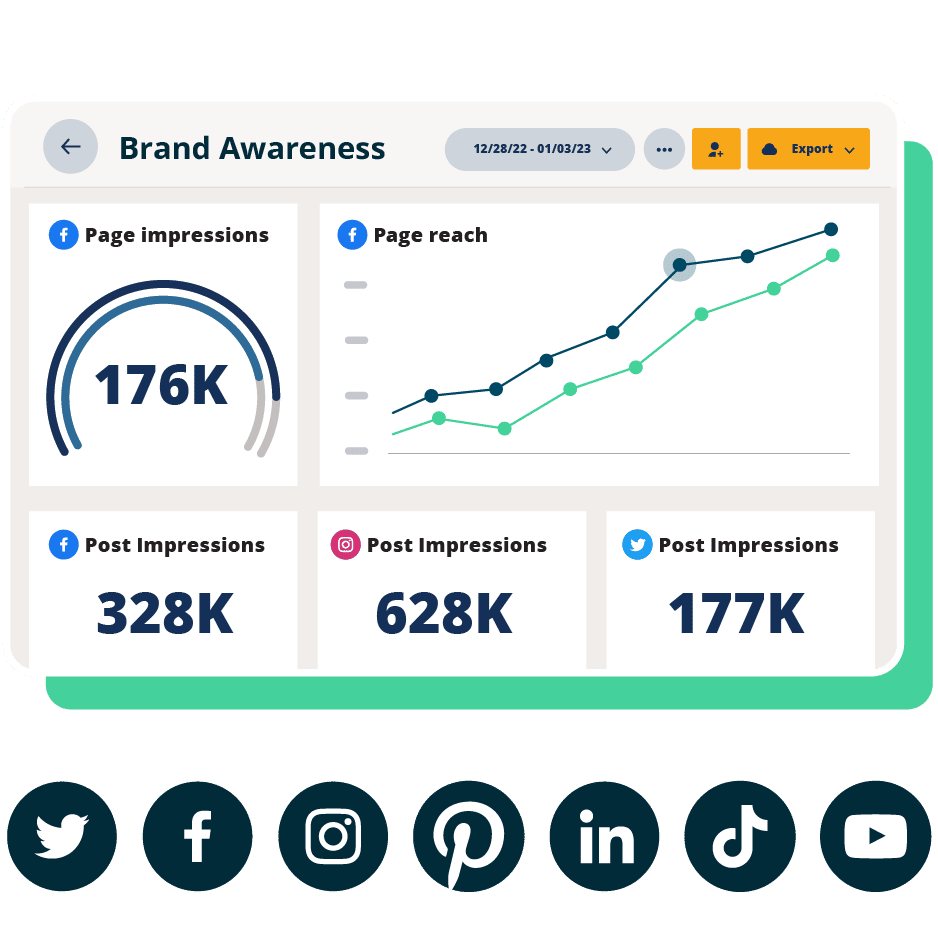
Today, in 2026, the industry has reached a state of "metric maturity." Marketers have moved away from one-size-fits-all formulas. Instead, they now employ a nuanced, multi-layered approach to measurement, segmenting data by campaign, time period, and specific platform-native behaviors. This shift is supported by advanced analytics tools like Hootsuite’s Perch, which allow teams to move past manual spreadsheet calculations and into real-time, automated performance tracking.
Supporting Data: 2026 Industry Benchmarks
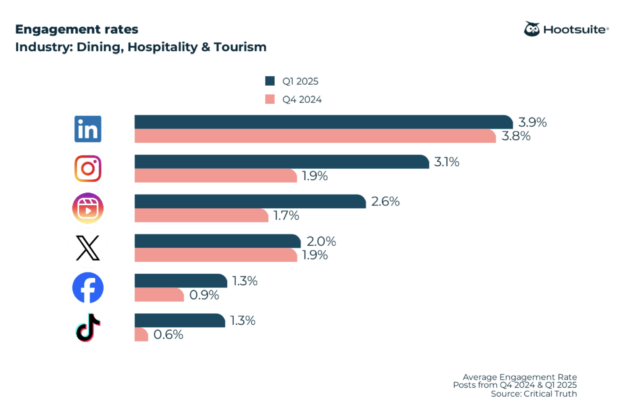
What constitutes a "good" engagement rate? While a universal standard is impossible, data scientists—notably in partnership with analytics firms like Critical Truth—have analyzed over one million posts to establish reliable 2026 benchmarks. Across all industries, a rate between 1% and 5% is considered standard.
Average Engagement Rates by Platform:
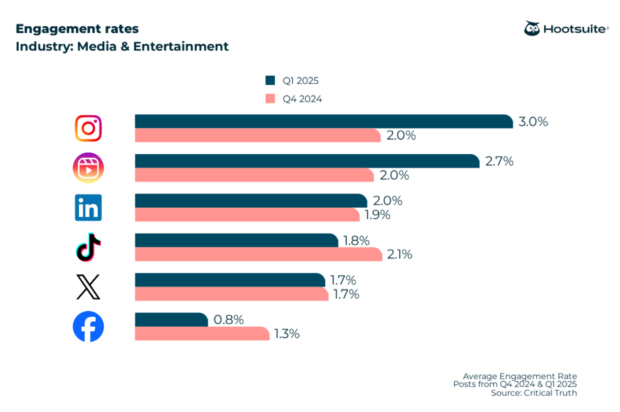
- Instagram (Overall): 3.0%
- Instagram Reels: 2.7%
- LinkedIn: 2.0%
- X (formerly Twitter): 1.8%
- TikTok: 1.5%
- Facebook: 0.8%
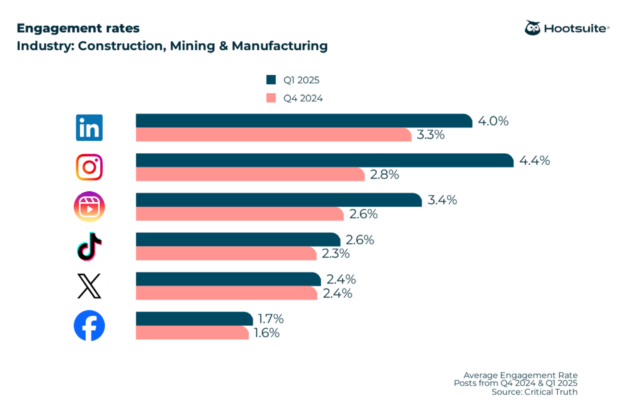
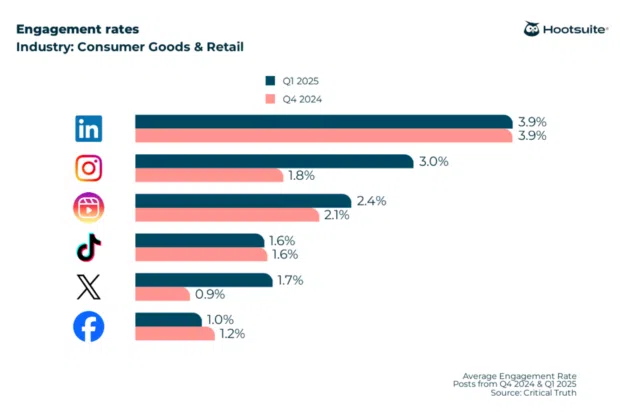
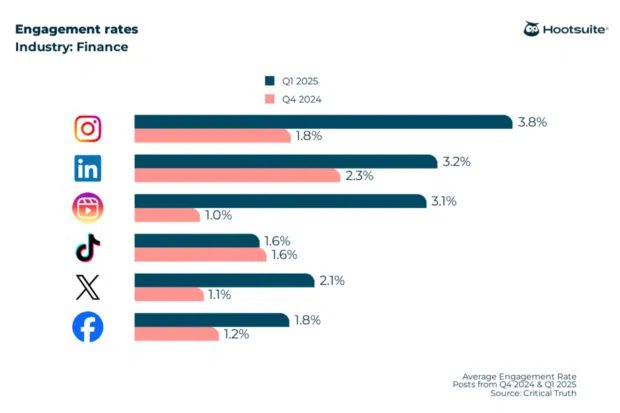
These numbers vary significantly by sector. For instance, the Nonprofit and Construction/Manufacturing sectors often see spikes in engagement (reaching upwards of 4.4% on Instagram) due to the highly visual and community-driven nature of their content. Conversely, the Financial Services industry benefits from high trust-based interactions, with Instagram remaining their strongest performer at 3.8%.

The Six Essential Formulas for Success
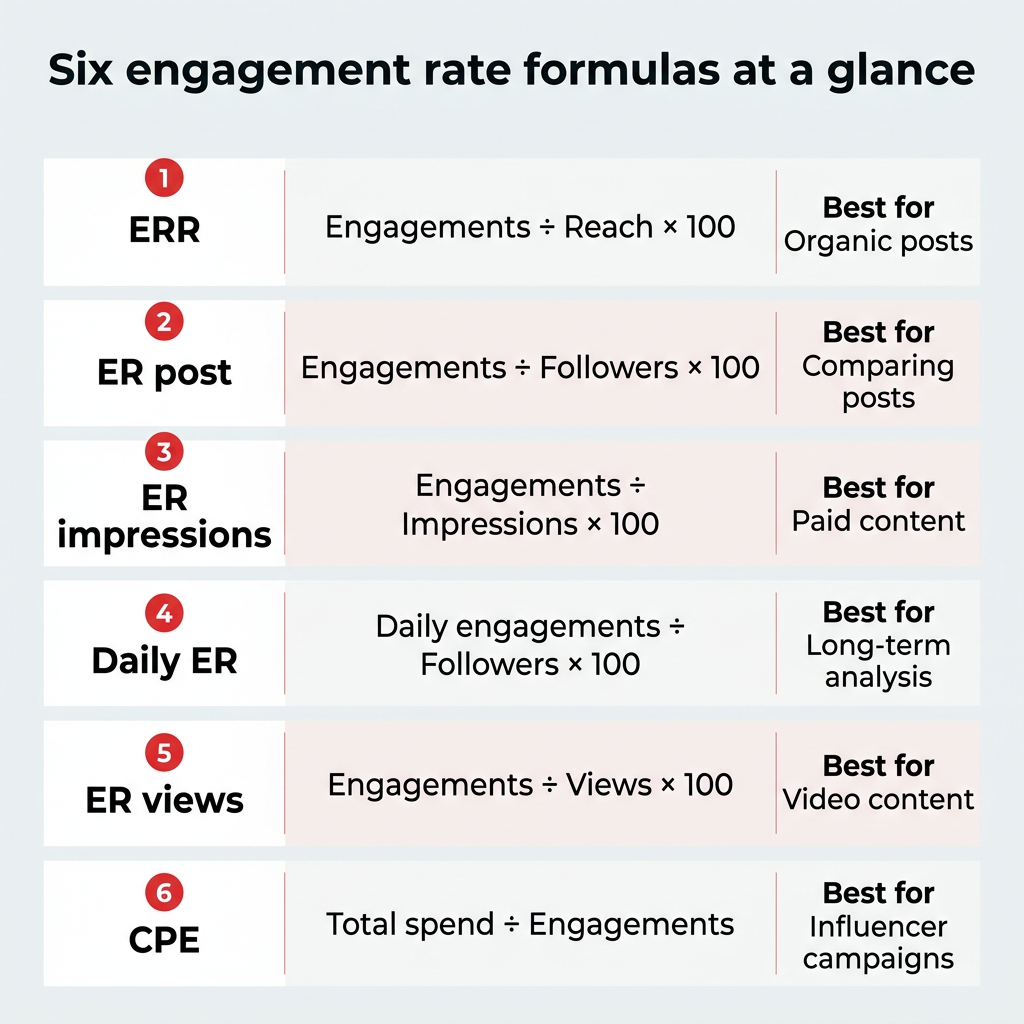
Choosing the right formula is as important as the calculation itself. The "denominator" you choose changes the story the data tells:
- Engagement Rate by Reach (ERR): The industry standard for organic content. It calculates interactions relative to the number of unique eyes on a post. It is the most accurate reflection of how well content performs with those who actually see it.
- Engagement Rate by Post (ER Post): Uses follower count as the denominator. This is the gold standard for influencers and creators looking to compare performance consistency across their own account history.
- Engagement Rate by Impressions (ER Impressions): Best for paid advertising. Since impressions count every time an ad hits a screen, this provides a realistic view of how "sticky" an ad is upon repeated viewings.
- Daily Engagement Rate (Daily ER): A long-term look at how an audience interacts with your account throughout the day, regardless of when the post was published.
- Engagement Rate by Views (ER Views): Crucial for video-first platforms. This measures interactions relative to video plays, helping to determine if the video content is driving action or just passive consumption.
- Cost per Engagement (CPE): An essential financial metric for marketing leads, measuring the dollar-cost of every interaction generated in a paid campaign.
Official Responses and Strategic Implications
Industry leaders emphasize that engagement rate data should never exist in a vacuum. The current strategic consensus is that engagement data must inform the "Content Lifecycle."
Strategic Implications:
- Iterative Planning: If data shows that carousels drive 20% higher engagement than static images for your brand, your content calendar must shift to prioritize that format.
- Timing Optimization: Advanced reporting now allows brands to identify the "Golden Hours"—the specific times when their audience is most likely to interact. Aligning publishing schedules with these peaks is a low-effort, high-reward strategy.
- Community Management: The "comment-back" strategy remains a top-tier tactic. By treating comments as a two-way conversation rather than a one-way broadcast, brands can artificially inflate their engagement rates by encouraging return visits and continued dialogue.
How to Improve Your Engagement Rate
If your current metrics fall below the industry averages listed above, improvement requires a shift in tactics:
- Audit the Content Mix: Stop guessing. Use analytics to identify your "High-Performing Content Clusters" and produce more of what the audience already validates.
- Leverage Interactive Features: Polls, Q&As, and "Ask Me Anything" formats on Instagram Stories or LinkedIn posts drastically lower the barrier to entry for audience participation.
- Prioritize Video: Video continues to dominate engagement benchmarks. Short-form, value-packed clips (Reels/TikToks) that solve a problem or provide immediate entertainment are the current leaders in driving interaction.
- Consistency Over Intensity: Algorithms reward accounts that keep users engaged regularly. A consistent cadence of high-quality posts will always outperform a sporadic blast of viral-attempt content.
Conclusion
Engagement rate is the ultimate "truth serum" of social media marketing. It cuts through the noise of vanity metrics and forces brands to answer the most important question in digital strategy: Does anyone actually care about what we are saying? By applying the correct formulas, benchmarking against industry peers, and using automated tools to track performance, brands can transition from shouting into the void to building a thriving, interactive community.
As we move further into 2026, the brands that win will be those that view every like, share, and comment not just as a data point, but as a conversation—one that, when nurtured, creates the most valuable asset in the digital age: a loyal, engaged audience.