
In an era where digital presence dictates market relevance, the sheer volume of data generated by social media can be overwhelming. With U.S. social ad spending projected to surpass $121 billion by 2026, businesses are no longer just posting content; they are managing complex, multi-channel ecosystems. At the heart of this operational evolution lies the social media dashboard—a centralized command center that transforms raw, fragmented data into actionable business intelligence.

The Core Function: Consolidating Chaos
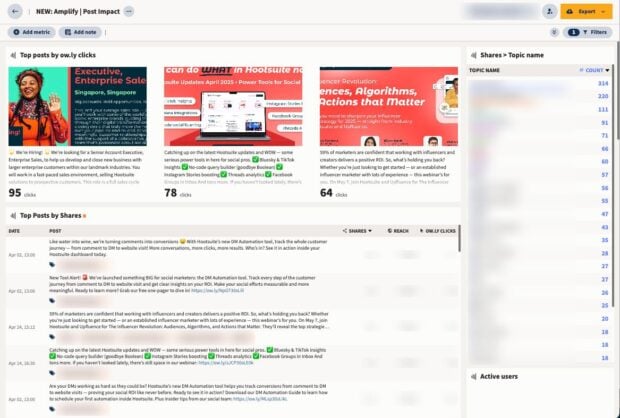
A social media dashboard serves as the connective tissue between disparate platforms. Traditionally, a social media manager might spend hours each week logging individually into Instagram, LinkedIn, Facebook, TikTok, and X to scrape performance metrics. This siloed approach is not only inefficient but often leads to "analysis paralysis," where data is collected but never synthesized.

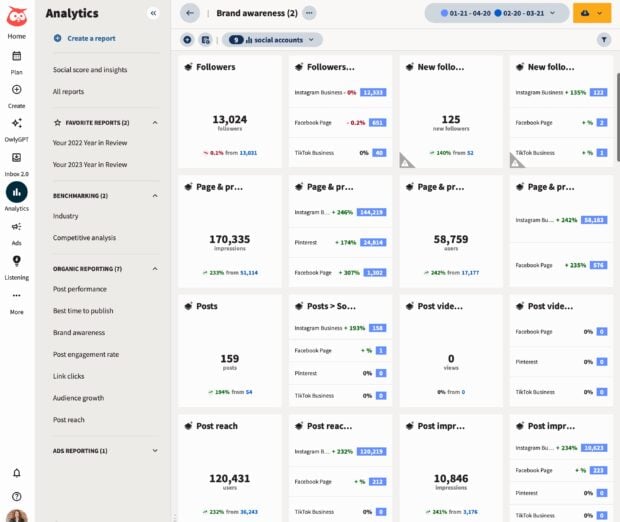
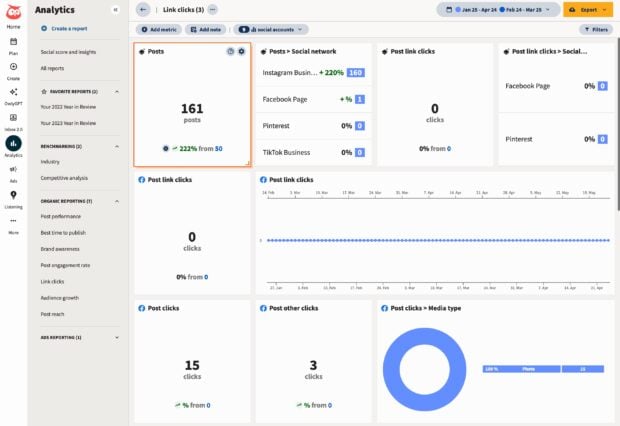
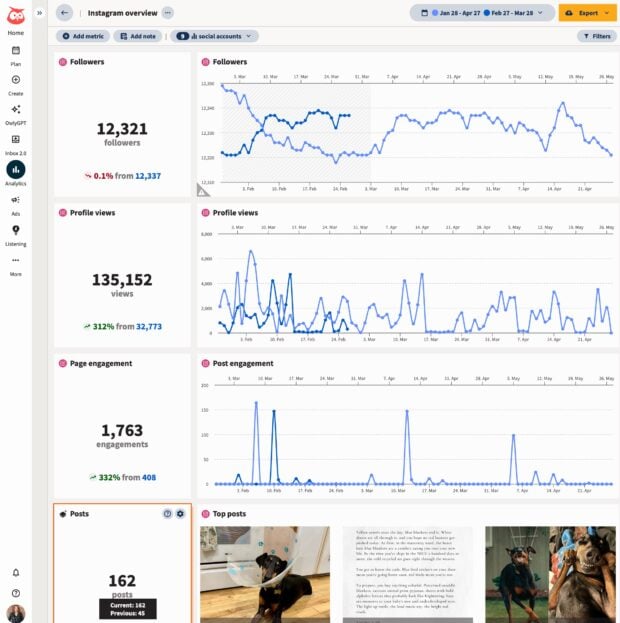
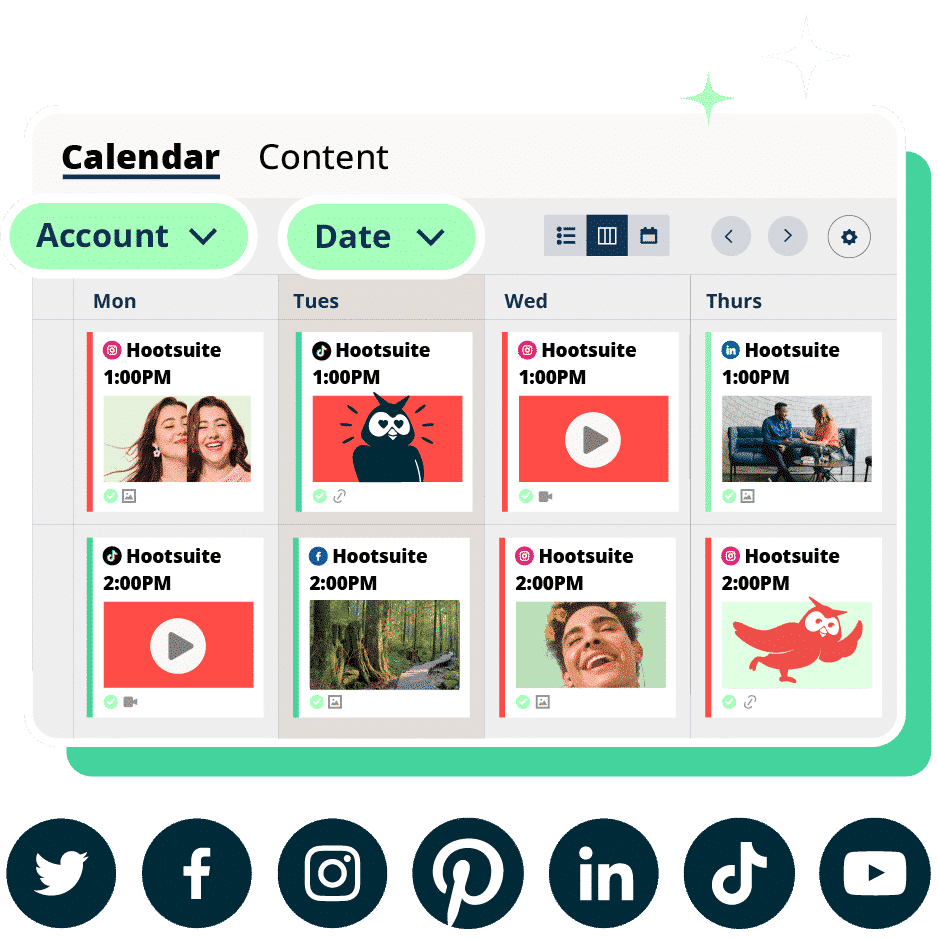
A robust dashboard aggregates these metrics into a single, visual interface. By normalizing data across platforms, these tools allow teams to see a holistic view of their brand’s health. Whether it is tracking real-time engagement or historical growth patterns, the dashboard ensures that every post, ad campaign, and customer interaction is mapped against core business objectives.
The Chronology of Measurement: From Vanity to Value
The journey of social media reporting has evolved significantly over the last decade. In the early days, "vanity metrics"—likes, shares, and follower counts—were the primary indicators of success. While these figures offer a surface-level pulse on brand popularity, they rarely correlate with bottom-line revenue.
As marketing budgets have tightened—with Gartner reporting that 59% of CMOs face budget constraints—the industry has shifted toward high-intent data. Today’s dashboards are built to track the full marketing funnel. We have moved from simple counting to advanced attribution:
- Phase 1 (The Early Era): Manual tracking of raw interaction numbers.
- Phase 2 (The Integration Era): The birth of cross-platform API integration, allowing for centralized reporting.
- Phase 3 (The Insight Era): AI-driven sentiment analysis, predictive modeling, and automated ROI reporting that directly ties social activity to lead generation and customer lifetime value.
Supporting Data: Why Dashboards Solve Operational Friction
The operational advantages of a centralized dashboard are quantifiable. Enterprise teams that migrate from native platform reporting to an integrated dashboard typically report a reduction in reporting time by 70-80%.
Consider the following critical pillars where dashboards provide immediate ROI:
- Reporting Efficiency: By automating the export of data and the generation of visual reports, teams can pivot their focus from data collection to strategy formulation.
- Real-Time Agility: When performance data is aggregated in real-time, teams can pivot during a campaign. If a specific ad format underperforms in the first 48 hours, a dashboard highlights this anomaly, allowing for immediate budget reallocation.
- Revenue Attribution: By integrating CRM data with social clicks, companies can track a user from their first interaction on a social platform to their final purchase, effectively closing the loop on "social ROI."
Strategic Dashboard Categories
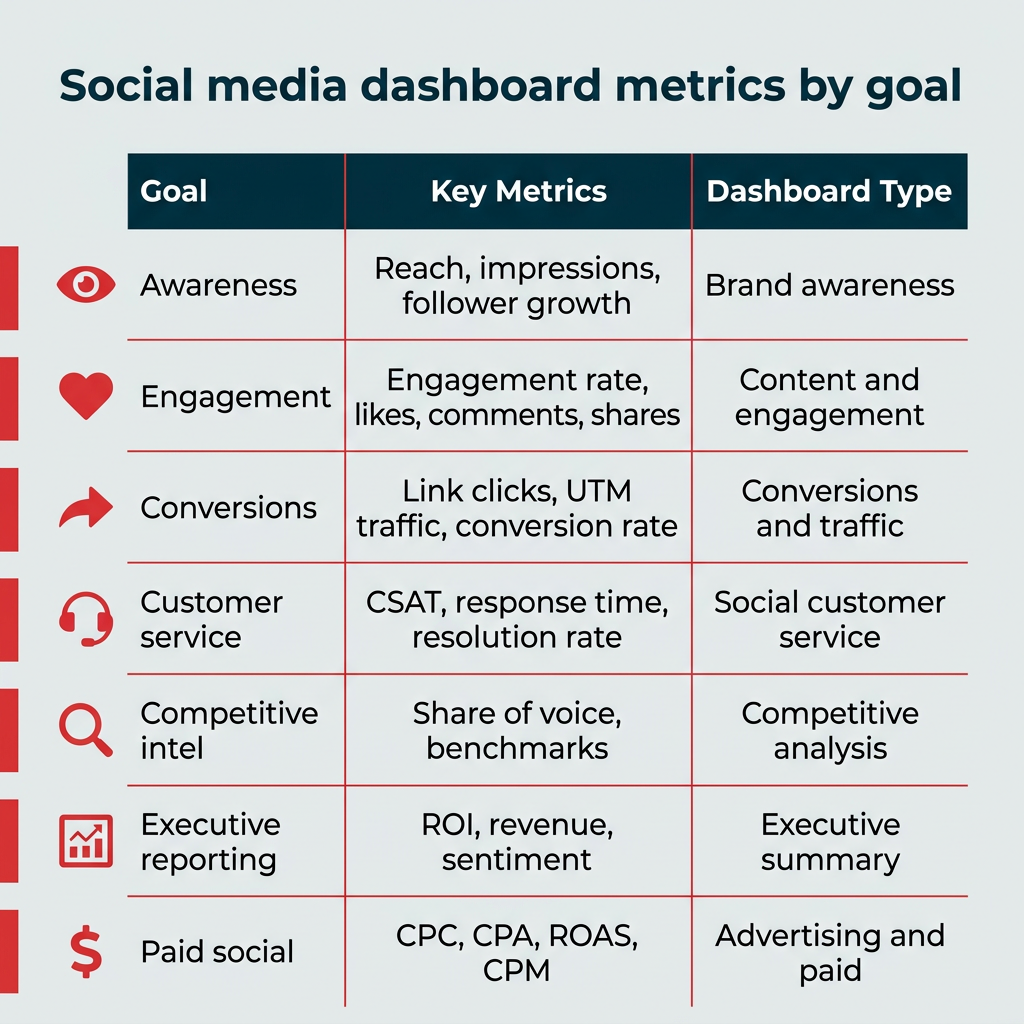
To be effective, a dashboard must be purpose-built. A "one-size-fits-all" approach leads to clutter. Successful organizations implement specialized dashboards for different business functions:
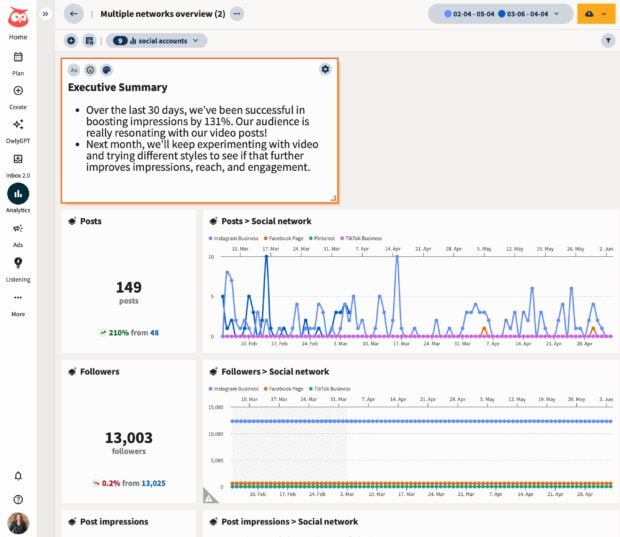
1. The Executive Summary Dashboard
Designed for the C-suite, this view strips away the technical noise. It focuses on high-level KPIs: year-over-year growth, total ROI, and progress toward quarterly objectives. It answers the fundamental questions: Is our investment working? Are we growing?

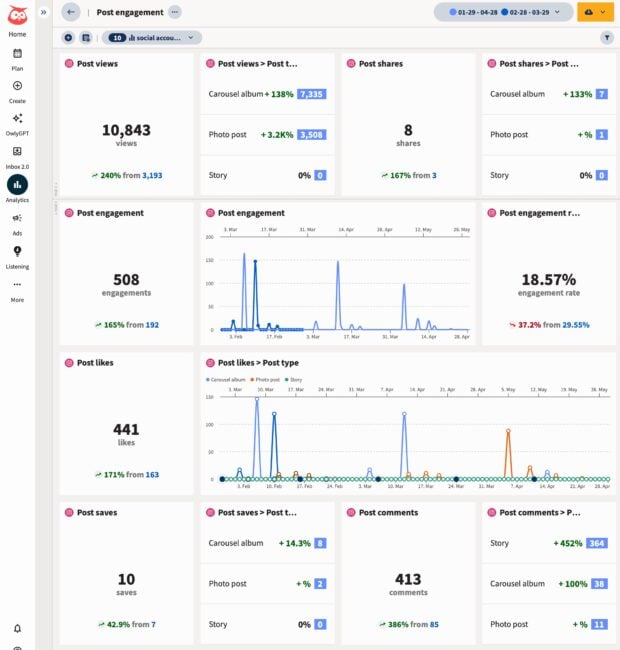
2. The Content and Engagement Dashboard
For the creative and community teams, this provides a granular look at what resonates. By tracking engagement rates, save counts, and sentiment, teams can identify which content pillars are "sticky" and which are falling flat, enabling a data-informed approach to content calendars.
3. The Social Customer Service Dashboard
In a landscape where 81% of customers demand faster resolution times, this dashboard is critical. It tracks response latency, ticket resolution rates, and CSAT (Customer Satisfaction) scores. It essentially turns a brand’s social inbox into a high-performance support desk.
4. The Competitive Intelligence Dashboard
This tool tracks "share of voice" against industry peers. By benchmarking your performance against competitors, you can identify market gaps and capitalize on shifts in consumer sentiment.
Official Perspectives: The Role of AI and Automation
Industry leaders, including those at Hootsuite, emphasize that the modern dashboard is no longer a passive display; it is an active participant in strategy. With the integration of Artificial Intelligence, dashboards can now perform "social listening" at scale.
"AI-enhanced insights can surface trends and anomalies that a human analyst might miss," notes industry documentation. For example, by analyzing millions of conversations in real-time, a dashboard can alert a brand to a potential PR crisis or a rising trend in their niche before it hits the mainstream. This predictive capability is what separates legacy marketing from modern, data-driven brand management.
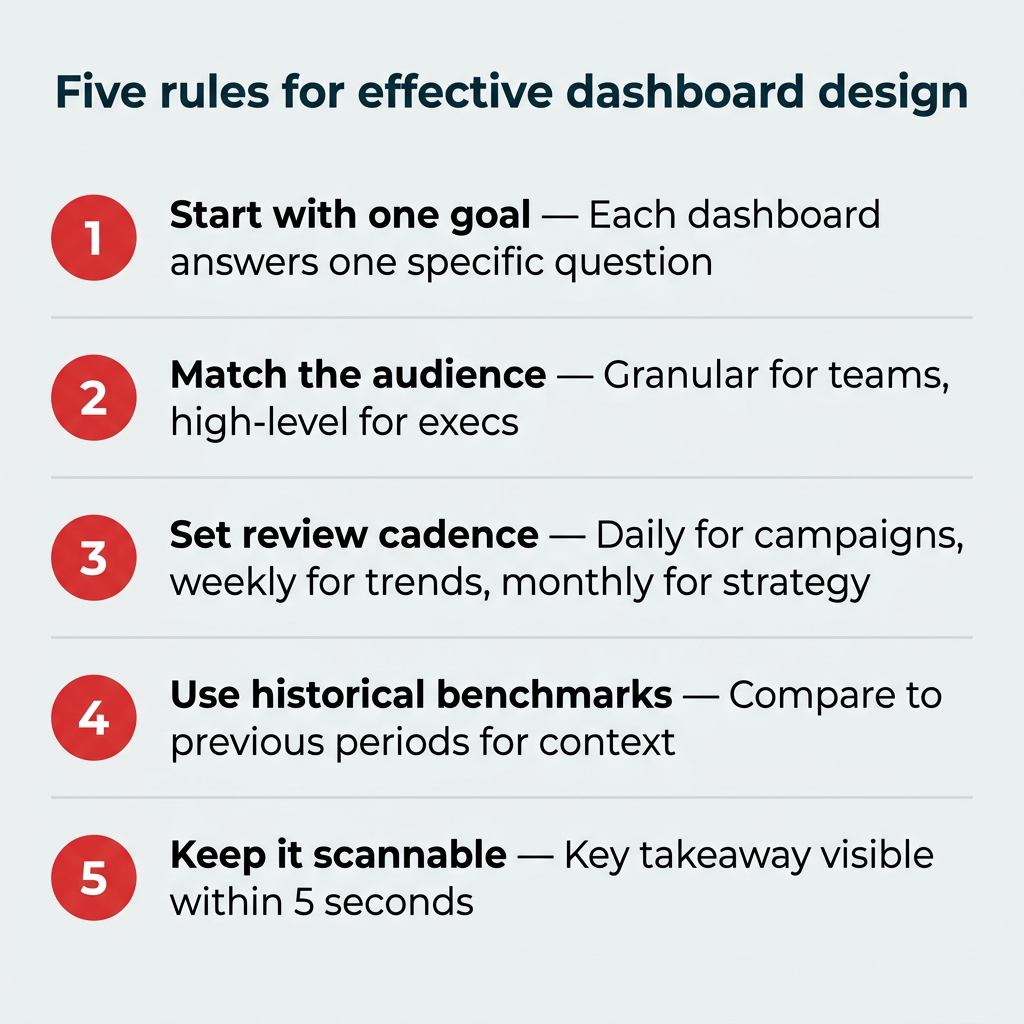
Implications for Future Strategy: The Five Rules of Design
As organizations scale, the management of these dashboards becomes as important as the data itself. To prevent the "dashboard clutter" that often plagues large organizations, experts recommend five best practices:
- Align with Goals: If a metric doesn’t move the needle on a specific business objective, remove it from the dashboard.
- Standardize Definitions: Ensure that "engagement" is defined the same way across all platforms (e.g., does a ‘like’ hold the same weight as a ‘share’?).
- Customize by Role: A social media intern needs different data than a CMO. Tailor access to the specific needs of the user.
- Contextualize with History: Data in a vacuum is useless. Always compare current performance against historical benchmarks.
- Audit Regularly: Technology and platform algorithms change rapidly. Audit your dashboard quarterly to ensure your connectors and KPIs are still relevant.
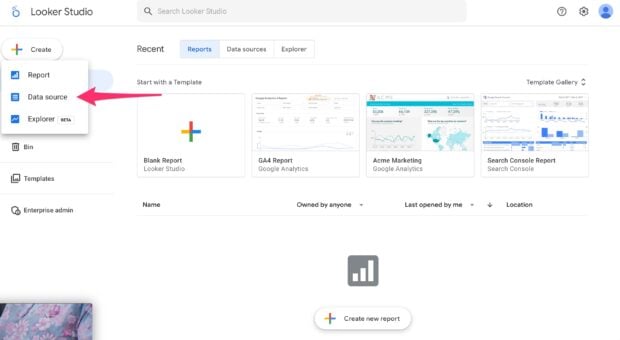
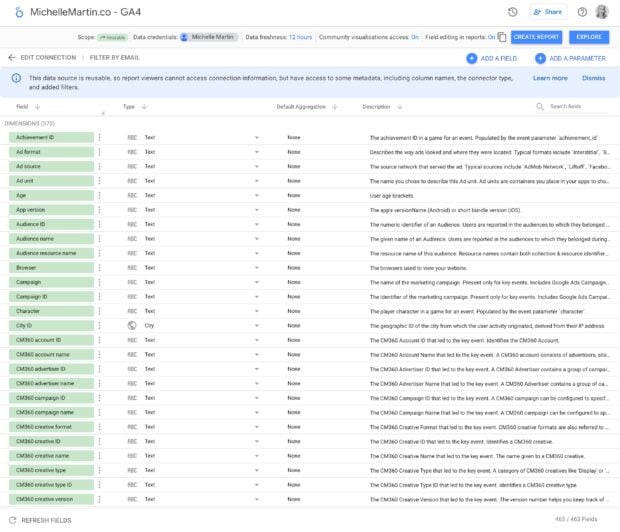
The DIY Dilemma: Building vs. Buying
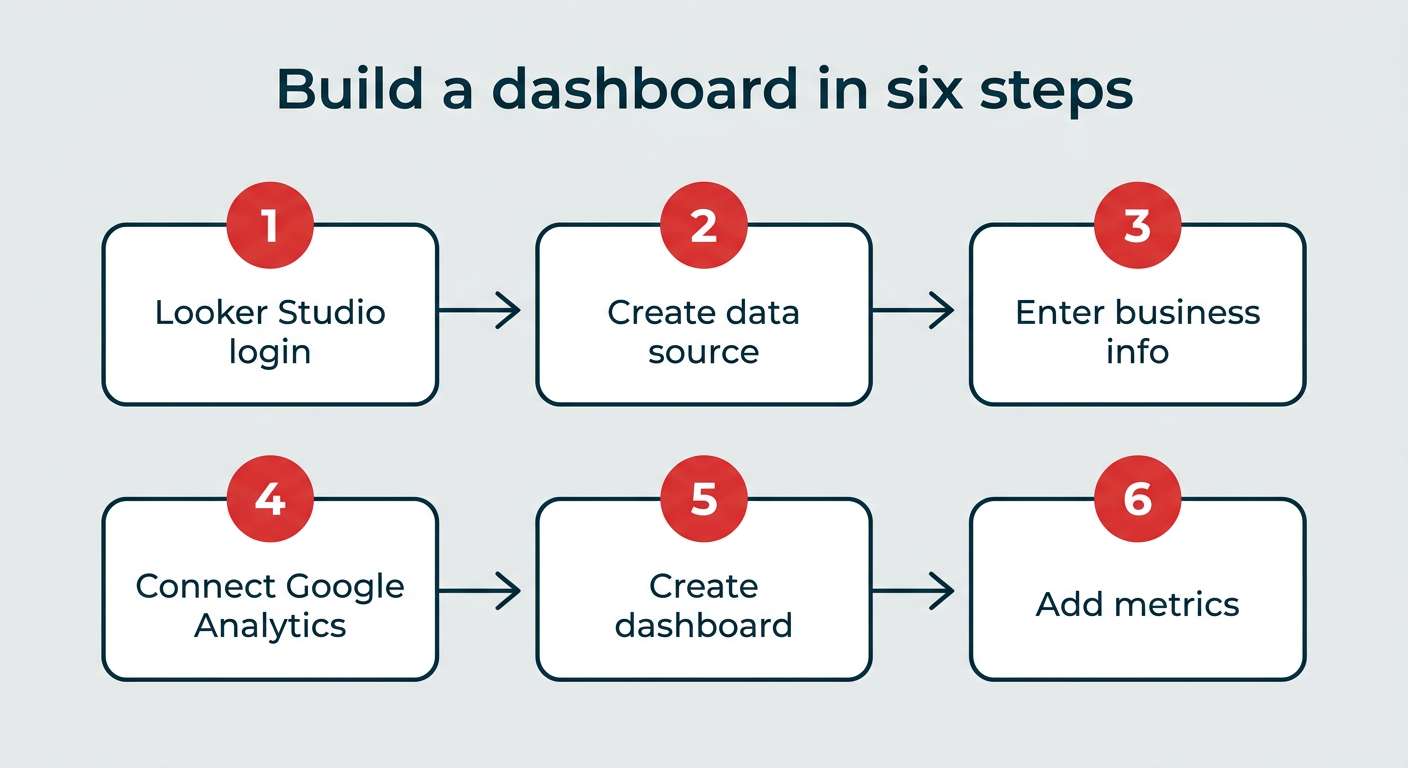
While tools like Google Looker Studio offer a "free" path to data visualization, there is a hidden cost: time and technical debt. Building a robust dashboard from scratch requires manual data piping, constant API maintenance, and significant design labor.
For many enterprises, the cost of the "free" solution—measured in lost productivity—often exceeds the cost of a comprehensive, all-in-one platform. A professional tool provides not just the visualization, but the underlying infrastructure to ensure data integrity as platforms change their API protocols.
Conclusion: The Path Forward
In the coming years, the divide between companies that "guess" and companies that "know" will only widen. A social media dashboard is the primary instrument of that knowledge. It bridges the gap between the creative art of content production and the scientific rigor of business analytics.
By moving away from fragmented, platform-specific reporting and toward a centralized, AI-supported command center, businesses can finally prove the value of their social media presence. As social media continues to consume a larger slice of the marketing pie, the dashboard will remain the most critical tool in a brand’s arsenal, turning the noise of the digital world into the signal of sustainable growth.