
 Reynand Wu
In the rapidly evolving landscape of digital marketing, the ability to translate social media activity into tangible business value has become the ultimate litmus test for CMOs. As we look toward 2026, the era of tracking “vanity metrics”—such as raw follower counts or simple likes—is effectively over. Today’s marketing leaders are under immense pressure to prove that every dollar spent on social media contributes directly to revenue growth.
To thrive in this environment, brands must pivot toward a data-driven strategy that prioritizes actionable insights. Whether you are managing organic community building or high-stakes paid advertising, understanding the mechanics of your social media performance is no longer optional—it is a competitive necessity.

The Strategic Framework: Metrics vs. KPIs
Before diving into specific data points, it is vital to distinguish between a metric and a Key Performance Indicator (KPI).
A metric is simply a measurement of what happened: How many people saw this post? How many liked it? A KPI, conversely, is a metric tied to a specific business objective. If your goal is to grow qualified leads by 15% this quarter, your KPIs might be conversion rate and cost-per-lead, while your metrics are the granular data points that reveal why you are (or are not) hitting those targets.

A common framework for balancing these goals is the 70/20/10 rule:
- 70% of your content delivers pure value to the audience (measured by reach and engagement).
- 20% leverages shared content from other sources (measured by community sentiment).
- 10% is directly promotional (measured by conversion rate and ROI).
Chronology of Social Measurement: From Awareness to Revenue
Modern social media strategy follows a logical progression, or "funnel," which dictates the order of operations for your reporting.
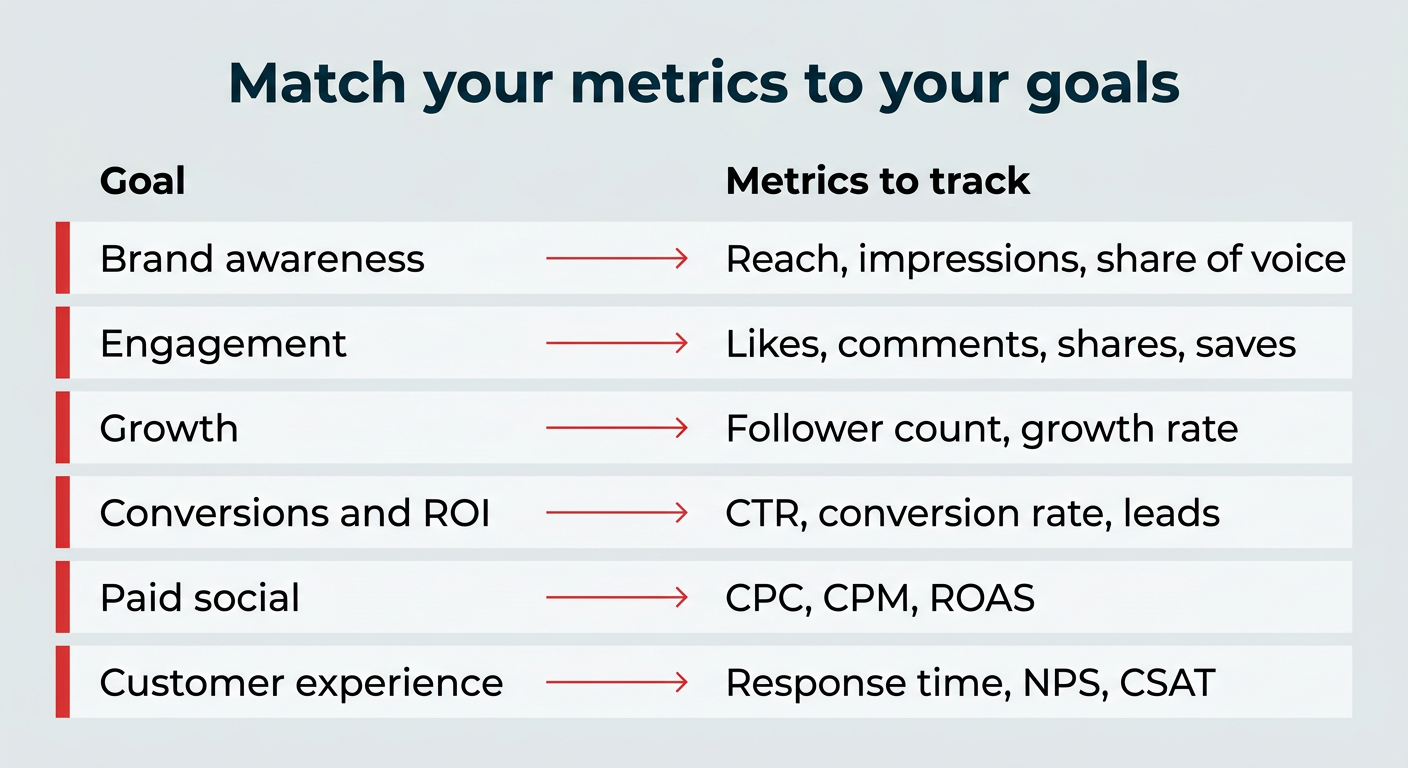
- Awareness Phase: You must first be seen. Metrics here include Reach, Impressions, and Social Share of Voice (SSoV).
- Engagement Phase: Once seen, you must hold attention. Metrics include Engagement Rate, Comments, and Saves.
- Conversion Phase: Finally, you must drive action. Metrics include Click-Through Rate (CTR) and Conversion Rate.
- Loyalty Phase: Long-term retention is measured by NPS and Customer Satisfaction (CSAT) scores.
By analyzing these in sequence, brands can identify exactly where in the funnel a campaign is failing, allowing for precise, data-backed optimizations.
Supporting Data: Understanding Platform Nuance
A critical challenge for 2026 is the lack of standardization across platforms. A “view” on YouTube is vastly different from a “view” on TikTok. For example, YouTube counts a view after 30 seconds, while TikTok registers it the moment the video starts playing.
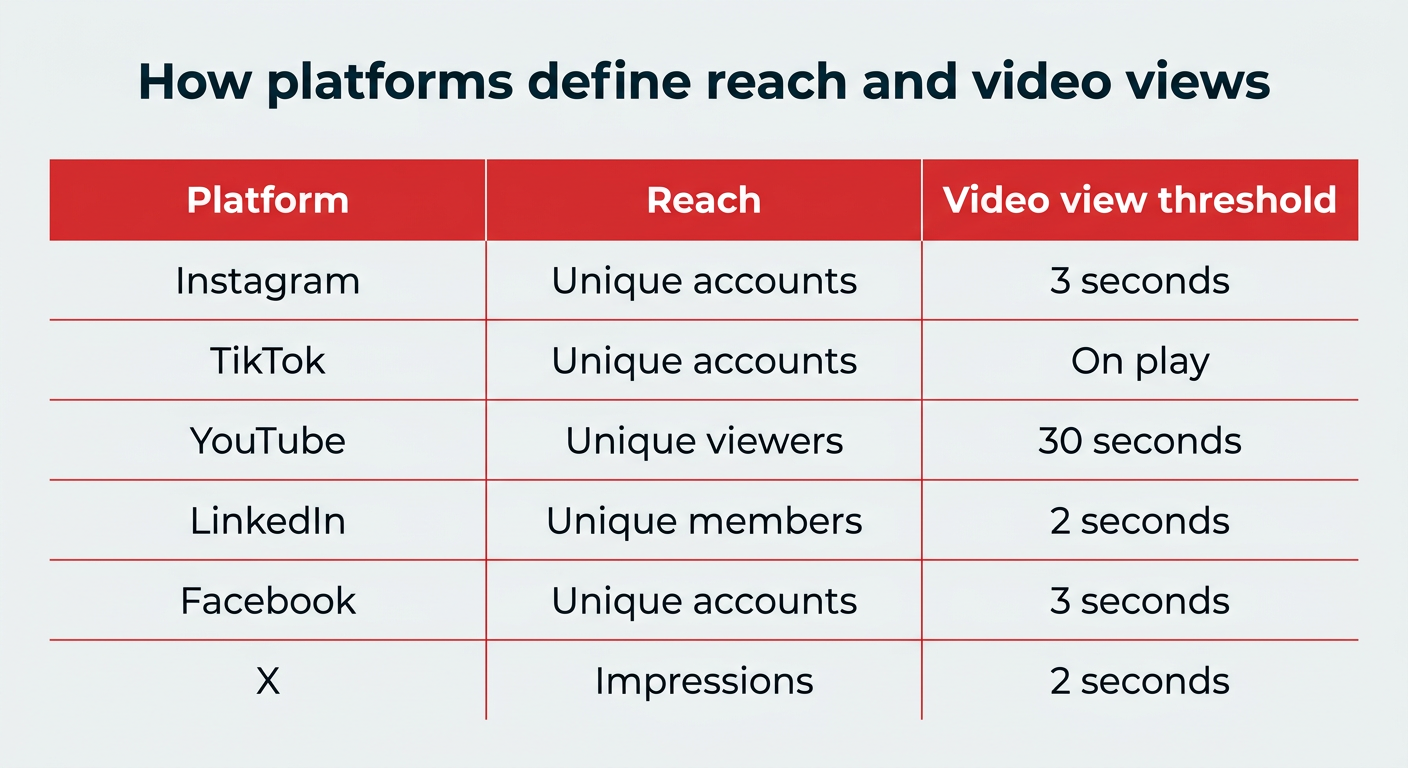
If you compare these figures blindly, your data will be skewed. Marketers must build their reports with a clear understanding of these definitions. When reporting to stakeholders, always include a disclaimer on how specific platforms calculate reach and video completion to ensure transparency.
Key Platform Definitions Table
| Platform | Reach Definition | Video Threshold |
|---|---|---|
| Unique accounts | 3 seconds | |
| TikTok | Unique accounts | Instant play |
| YouTube | Unique viewers | 30 seconds |
| Unique members | 2 seconds (50% in view) | |
| Unique accounts | 3 seconds |
The 25 Essential Metrics for 2026
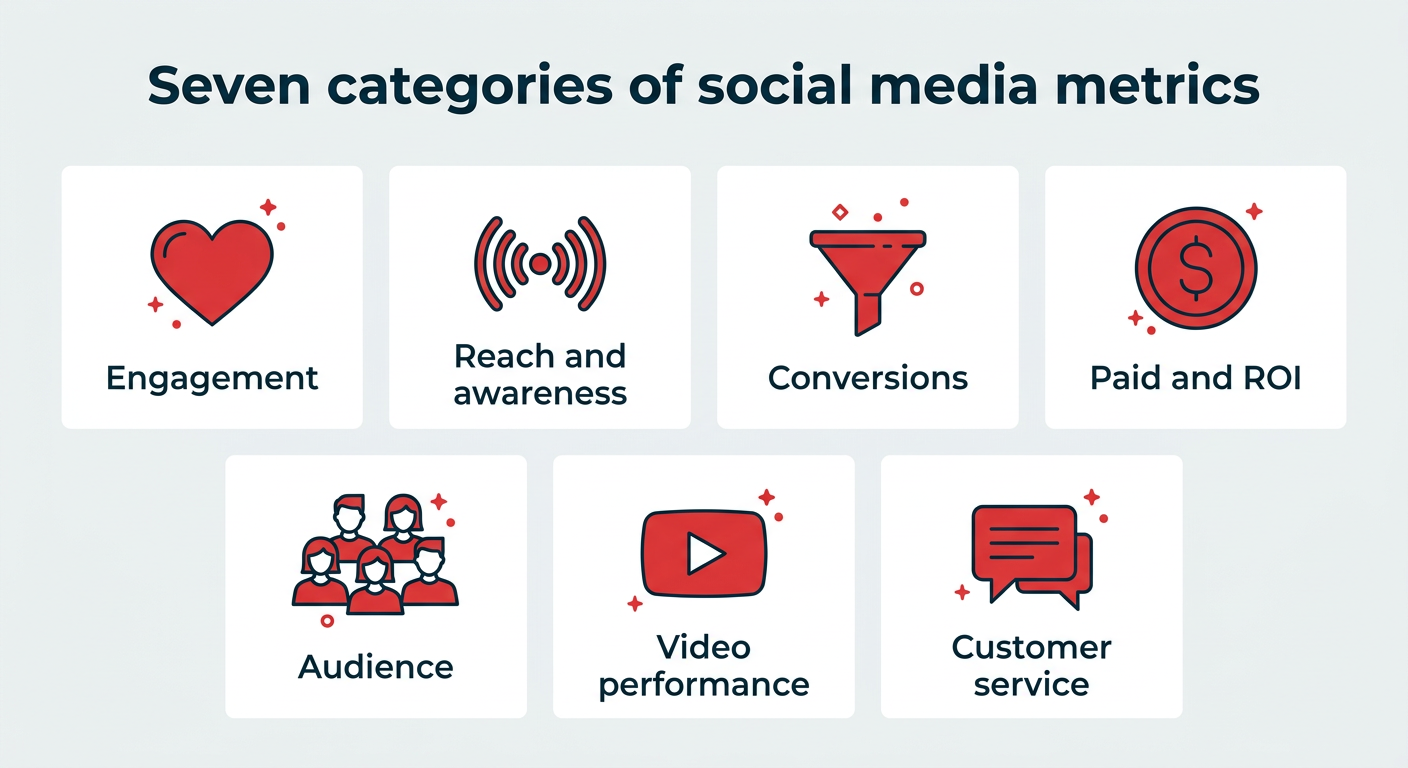
I. Engagement Metrics
Engagement is the lifeblood of algorithm performance.
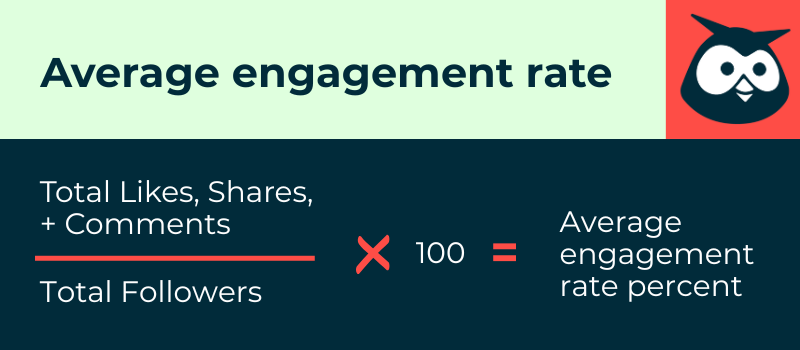
- Engagement Rate: The gold standard for measuring resonance. Formula: (Likes + Comments + Shares + Saves) ÷ Total Followers × 100.
- Likes/Reactions: The quickest way to gauge initial interest.
- Comments: A high-intent signal indicating the content sparked a conversation.
- Shares: The ultimate form of social validation; it means your content was worth attaching someone’s personal brand to.
- Saves: High-intent bookmarking. A high save rate is a signal to the algorithm that your content is valuable reference material.
II. Reach and Awareness
- Reach: The number of unique individuals who saw your content.
- Impressions: The total volume of views, including repeat exposures.
- Social Share of Voice (SSoV): Your brand’s presence relative to competitors in industry conversations.
- Social Search Visibility: How often your brand appears in in-app searches (e.g., TikTok or Instagram Search), which is increasingly replacing traditional search engines for Gen Z.
III. Conversion and ROI
- Conversion Rate: The percentage of users who complete a desired action (e.g., signing up or purchasing).
- Click-Through Rate (CTR): The percentage of users who click your CTA links.
- Cost Per Click (CPC): The efficiency of your paid spend in driving traffic.
- Cost Per Thousand Impressions (CPM): Useful for measuring brand awareness campaigns.
- Return on Ad Spend (ROAS): The bottom-line metric for paid social profitability.
IV. Audience and Sentiment
- Follower Count: Still relevant for tracking long-term growth.
- Follower Growth Rate: The speed at which your community is expanding.
- Social Sentiment: The emotional tone of mentions (positive, negative, or neutral).
- Demographics: Understanding the age, location, and interests of your audience to sharpen targeting.
V. Video Performance
- View Count: A basic pulse check on content visibility.
- Video Completion Rate: The percentage of viewers who finish your video—a strong signal of quality.
- Watch Time: The total duration viewers spend with your content, signaling "stickiness."
VI. Customer Service
- Average Response Time: How quickly your team addresses inquiries.
- Customer Satisfaction (CSAT): Direct feedback on service quality.
- Net Promoter Score (NPS): A measurement of customer loyalty and advocacy.
- Referral Traffic: The volume of visitors moving from social platforms to your website, tracked via UTM parameters.
Official Industry Perspectives
Marketing experts emphasize that the complexity of tracking has increased alongside privacy regulations. With the phase-out of third-party cookies, tracking a user from a social post to a website conversion requires meticulous use of UTM parameters. As Trish Riswick, a noted social media strategist, suggests, "The comment section is filled with inspiration and feedback, but it’s also a vital metric to track as it demonstrates the effectiveness of your posts and the increase in brand affinity."
Implications for 2026 Strategy
What do these numbers mean for your long-term planning? The implication is clear: measurement must be a loop, not a static report.
- Turn Data into Action: If your video completion rate is low, shorten your hooks. If your CTR is high but your conversion rate is low, your landing page is likely the problem, not your social content.
- Benchmark Against Yourself: Industry benchmarks are helpful, but your own historical data is the best predictor of future success.
- Prioritize Unified Reporting: Use tools like Perch or native business suites to stitch data together. If you cannot see the full picture, you cannot make an informed strategy shift.
- Align with Revenue: Every report presented to leadership should explicitly link social activity to business outcomes—leads generated, sales closed, or customer service costs reduced.
- Iterate Continuously: Social algorithms change monthly. Your tracking strategy must be flexible enough to account for platform updates, new features, and shifting user behaviors.
By mastering these 25 metrics, brands can stop guessing and start leading. In the competitive landscape of 2026, those who measure effectively will be the ones who define the future of their industry.


 Nana
Nana
 Raul Delapena Setiawan