
In the modern digital landscape, video has transcended its status as merely another content format; it has become the primary language of the internet. From the hyper-fast pacing of TikTok to the professional-grade storytelling on LinkedIn, social video is the engine driving brand awareness, community engagement, and direct conversion. However, for many marketing teams, the reliance on "vanity metrics"—surface-level indicators like view counts and simple likes—is proving to be a strategic liability.
If your video strategy is built on superficial data, you are likely missing the most critical insights into why your audience is (or isn’t) watching. To succeed in 2025 and beyond, businesses must pivot toward a more nuanced, data-driven approach to social video performance.

The Strategic Importance of Video Analytics
Social video metrics are the quantitative heartbeat of your digital presence. At their core, these metrics track how, when, and why viewers interact with your content. They transform the “what” of a campaign into the “why,” offering a diagnostic lens through which marketers can refine their creative output and campaign architecture.
For businesses, the stakes are high. Effective measurement allows for the optimization of ad spend, the strengthening of audience relationships, and the ability to prove Return on Investment (ROI) to stakeholders. Without a rigorous analytical framework, video production is simply guesswork.

9 Essential Social Video Metrics to Monitor
To gain a comprehensive understanding of your content’s impact, you must look beyond the surface. Here are the nine metrics that truly define performance.
1. View Count: The Baseline of Reach
While often criticized as a vanity metric, the view count remains the fundamental measure of brand awareness. However, it is vital to remember that each platform defines a “view” differently. For instance, TikTok may count a view at one second, while YouTube requires 30 seconds for a full tally. As platforms like Instagram shift toward making views the primary metric across all content, understanding the context behind the number is essential.

2. Engagement Rate: The Pulse of Resonance
Engagement—likes, comments, shares, and saves—is the clearest indicator of whether your content has resonated. As Adam Mosseri, Head of Instagram, has noted, engagement is a primary signal for algorithm ranking. When viewers take the time to comment or interact, they are signaling to the platform that your content provides genuine value.
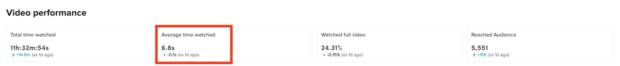
3. Average Watch Time: The Quality Signal
This metric provides an unfiltered look at content quality. If you are posting a 60-second video and the average watch time is only three seconds, the data is telling you that your hook failed. Conversely, if a viewer watches a short video multiple times, it signals high interest and "loopability."
4. Follower Growth Rate
Tracking how many new followers are acquired directly following a video post helps identify which content formats act as "magnets" for new subscribers. This is critical for businesses focused on sustainable audience expansion.
5. Shares: The Word-of-Mouth Metric
Shares represent a high-intent action. When a user shares your video, they are acting as a brand advocate, extending your reach to their own network. Because shares are highly favored by discovery algorithms, they are often the secret ingredient to viral success.
6. Saves: The Ultimate Vote of Confidence
Saving a video requires more effort than a simple "like." When a user saves your content, they are essentially bookmarking it for future reference. This indicates that your content is educational, evergreen, or highly entertaining—all of which are strong ranking signals.
7. Traffic Source: Mapping the Journey
Understanding where your viewers originate—whether through search, discovery feeds, or external referrals—allows you to optimize your distribution strategy. If a high percentage of traffic comes from search, it may be time to double down on SEO-friendly video captions and keywords.
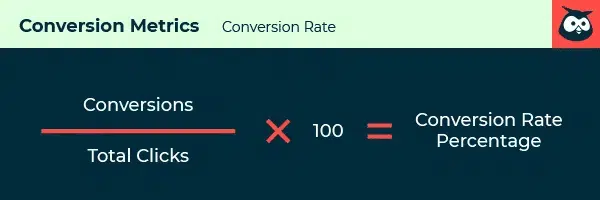
8. Conversion Rate: The Bottom Line
For marketing professionals, this is the most critical KPI. Conversion rate measures how many viewers performed a specific action, such as clicking a link, downloading a resource, or making a purchase. This is the ultimate proof of whether your video strategy is driving business results rather than just noise.
9. Retention and Drop-off Points
Retention graphs are the most surgical tool in your analytical arsenal. By identifying exactly where viewers stop watching, you can pinpoint “dead zones” in your pacing and adjust your editing style to keep audiences engaged longer.
Expert Strategies for Performance Optimization
I spoke with Mariam (MJ) Ordubadi, Head of Marketing at Aequilibrium, to discuss how brands can leverage these insights to elevate their video game. She emphasizes that success is not accidental; it is engineered.
1. The Three-Second Rule
Ordubadi argues that the first three seconds are "prime real estate." To stop the scroll, she recommends the "Problem/Solution" hook. By stating a specific, relatable problem immediately, you promise immediate value, which encourages the viewer to stay.
2. Matching Length to Platform Psychology
There is no universal "right" length for video. "I follow the ‘as short as possible, as long as necessary’ rule," says Ordubadi. While sub-30-second clips dominate discovery on TikTok and Reels, educational content on LinkedIn can thrive at the two-to-three-minute mark, provided every second adds value.
3. Engineering for "Loopability"
Looping—where a video is designed to be watched multiple times—is a powerful tactic. By adding subtle visual Easter eggs or tightly scripted conclusions that lead back to the start, you can artificially boost your watch time and signal high value to the algorithm.

4. Embracing AI-Native Formats
The rise of AI-assisted video formats, such as "talking document" explainers, is changing how B2B brands deliver information. By blending professional clarity with authentic, human-led walkthroughs, brands can build trust with professional audiences effectively.
Implications for Future Strategy
As we move deeper into 2025, the gap between brands that understand their metrics and those that don’t will continue to widen. The implications for marketers are clear:
- Stop Relying on Aggregates: Stop looking at total views and start looking at retention graphs.
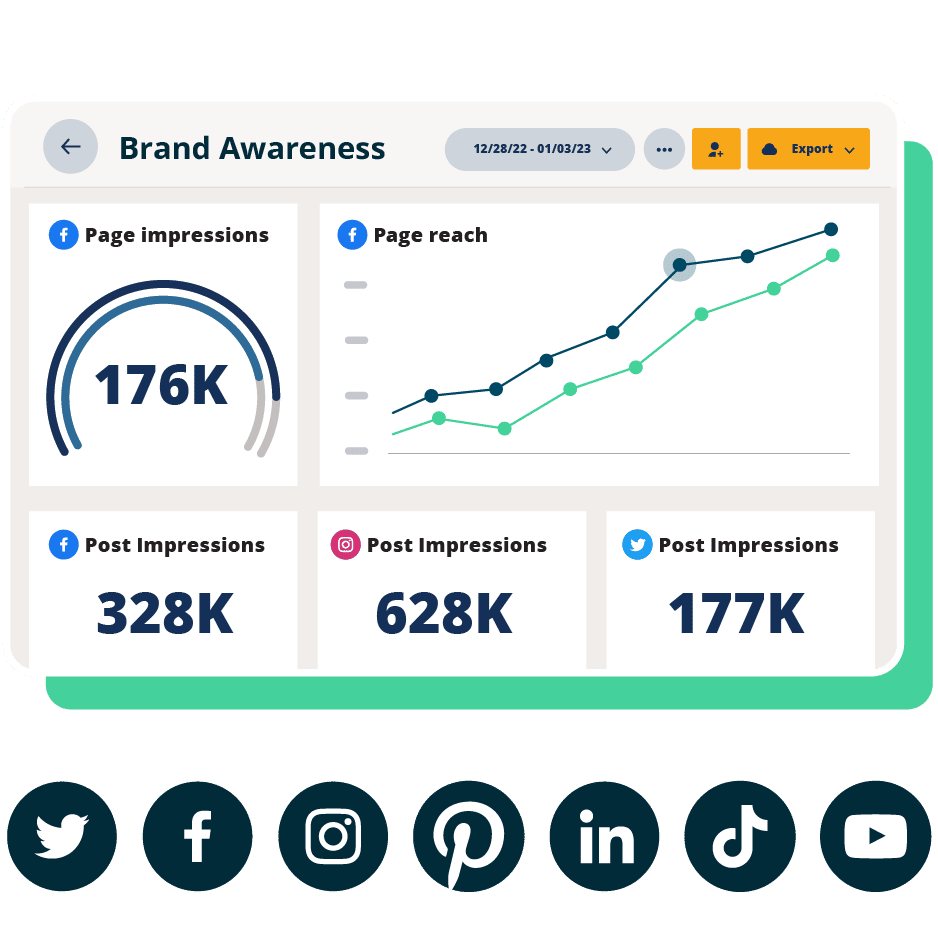
- Align KPIs with Goals: A brand awareness campaign should be measured by reach and impressions; a community-building campaign should be measured by saves and shares.
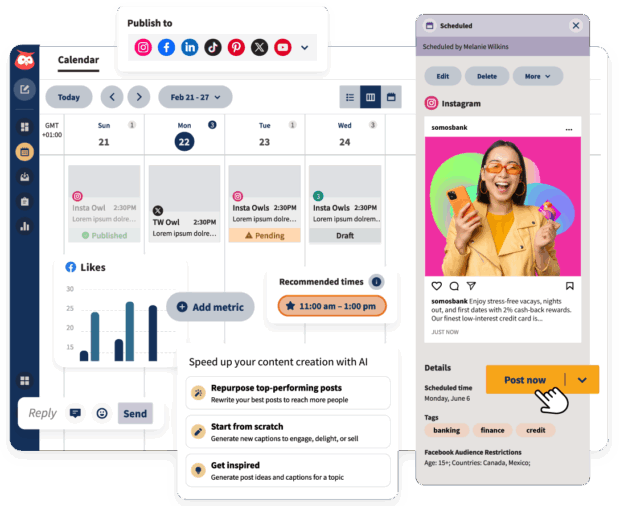
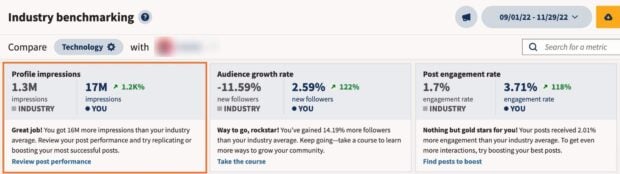
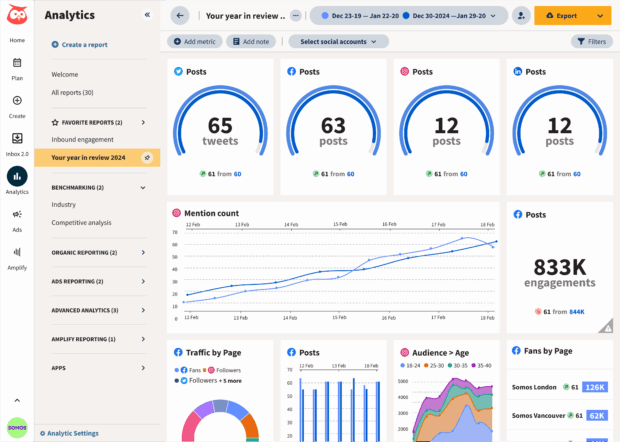
- Utilize Professional Tooling: Native platform analytics are useful, but for cross-channel consistency, dedicated tools like Hootsuite Analytics are necessary to provide a unified dashboard and reportable, actionable data.
Conclusion: The Path Forward
Ultimately, the numbers behind your social videos are not just data points—they are a conversation with your audience. They tell you what they enjoy, what they ignore, and what they value. By treating your analytics as a feedback loop, you can transition from chasing trends to building a robust, high-performing video strategy that drives both engagement and real-world revenue.
The next step is simple: select your two most important KPIs, refine your content based on your retention data, and begin testing. The tools to measure, optimize, and grow are at your fingertips; it is time to use them with intention.