
In the hyper-competitive landscape of modern social media marketing, vanity metrics like follower counts have largely been relegated to the background. Today, the true currency of digital influence is engagement rate. For brand managers, enterprise marketing teams, and content creators, understanding how to accurately measure, analyze, and optimize this metric is no longer optional—it is the cornerstone of proving return on investment (ROI) and mastering algorithmic reach.
As we move through 2026, the complexity of social media algorithms makes engagement a non-negotiable performance indicator. Whether you are tracking the success of a viral campaign or conducting a longitudinal audit of your brand’s social health, the ability to translate raw interactions into actionable data is what separates successful brands from those lost in the noise.

What Is Engagement Rate and Why Does It Matter?
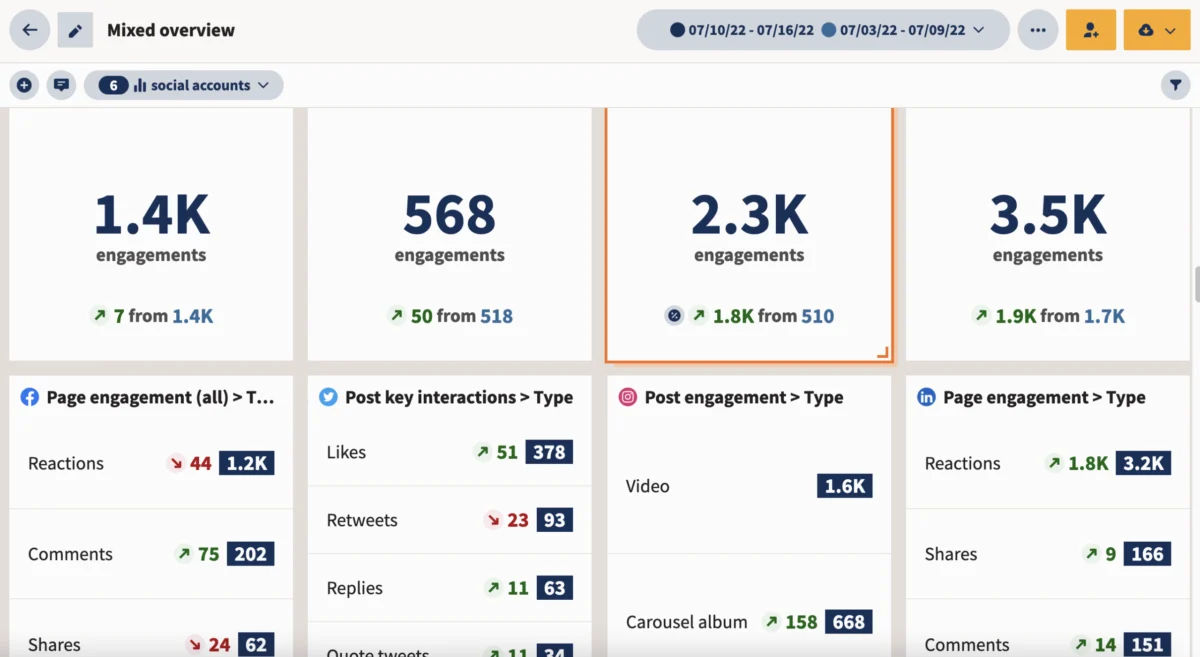
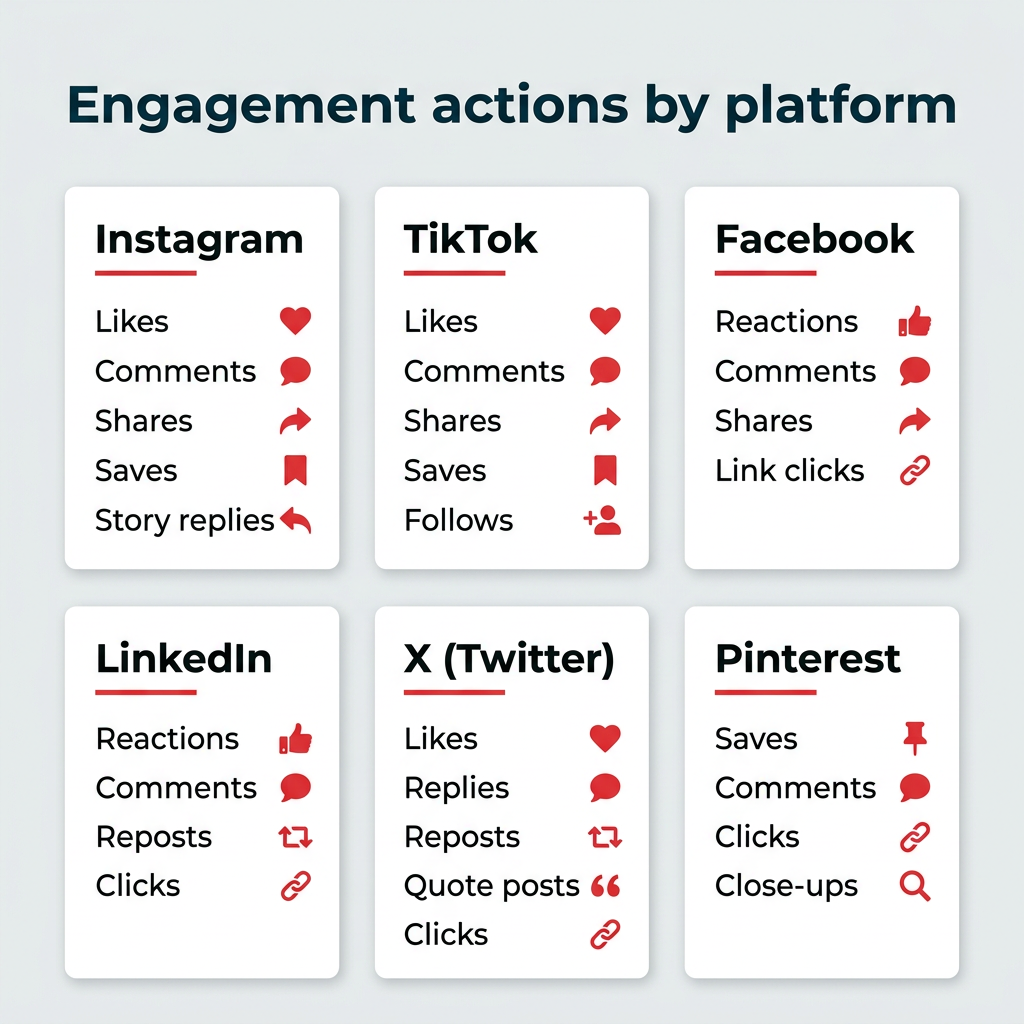
At its core, the engagement rate is a performance metric that quantifies how actively your audience interacts with your content. Unlike "reach" or "views," which are passive metrics representing exposure, engagement measures the actual conversation: the likes, comments, shares, saves, and link clicks that indicate a user has stopped scrolling to connect with your brand.
The Strategic Significance
Engagement rate matters for three critical reasons:

- Algorithmic Favorability: Social platforms prioritize content that generates immediate interaction. High engagement signals to algorithms that your content is valuable, prompting the platform to surface your posts to wider, new audiences.
- Building Trust and Authority: An active comments section or a high share count acts as "social proof." When a first-time visitor lands on your profile and sees that others are interacting with your brand, your credibility increases instantly.
- Proving ROI to Stakeholders: For enterprise teams, engagement is the clearest bridge between creative content and business outcomes. It demonstrates that the audience is not just seeing the content, but finding it relevant enough to invest their time in it.
Chronology of Metrics: From Impressions to Intent
The evolution of social media measurement has shifted from volume-based tracking to intent-based analysis. In the early days of social media, "impressions" were the gold standard. However, as the digital ecosystem became saturated, brands realized that being "seen" did not mean being "remembered."
- 2010–2015: The "Like" era, where simple volume was the primary indicator of success.
- 2016–2020: The rise of deep engagement. Platforms introduced "Saves," "Shares," and "Video Completion" metrics, shifting the focus to high-intent actions.
- 2021–2026: The era of the "Algorithm-First" approach. Today, engagement is viewed through the lens of reach-based percentages, acknowledging that not every follower sees every post.
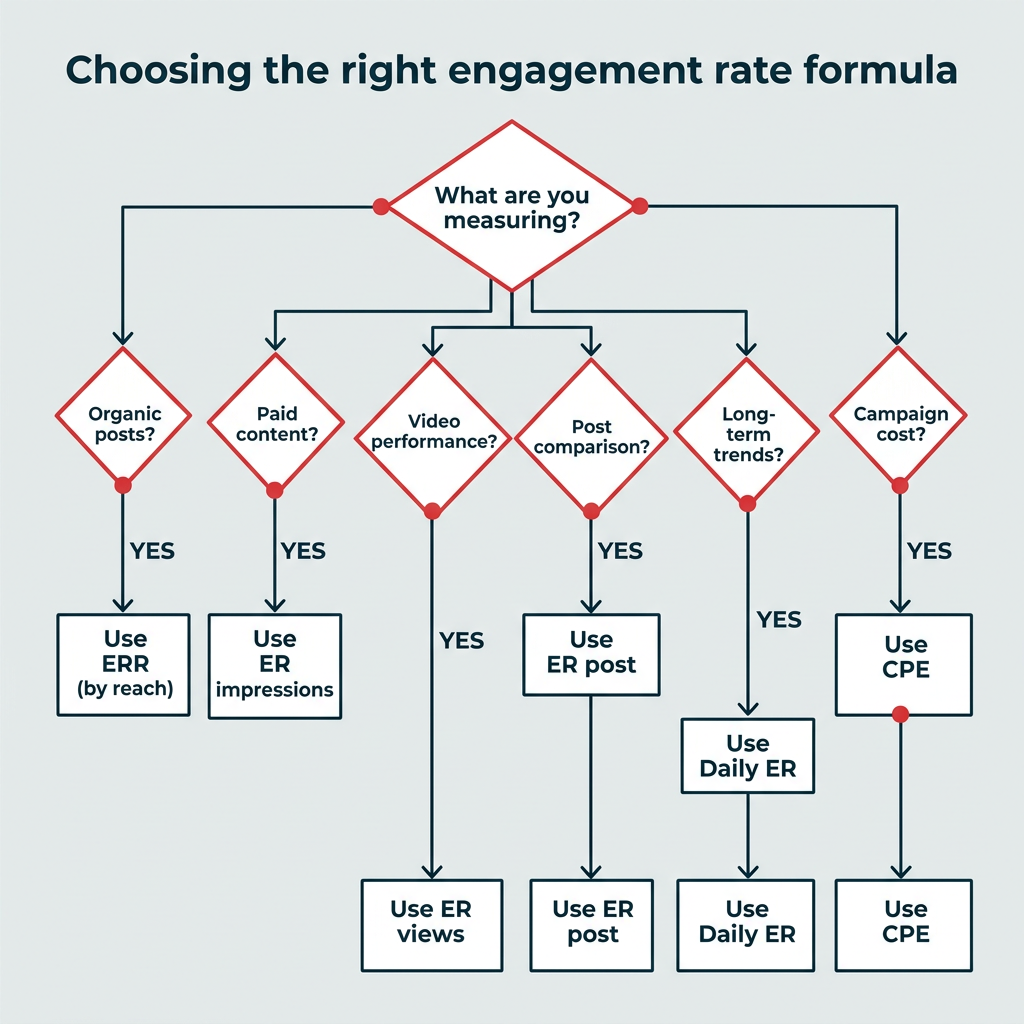
The Six Essential Formulas for Success
Because engagement is multifaceted, no single formula tells the whole story. Professionals use different calculations depending on their specific objectives.
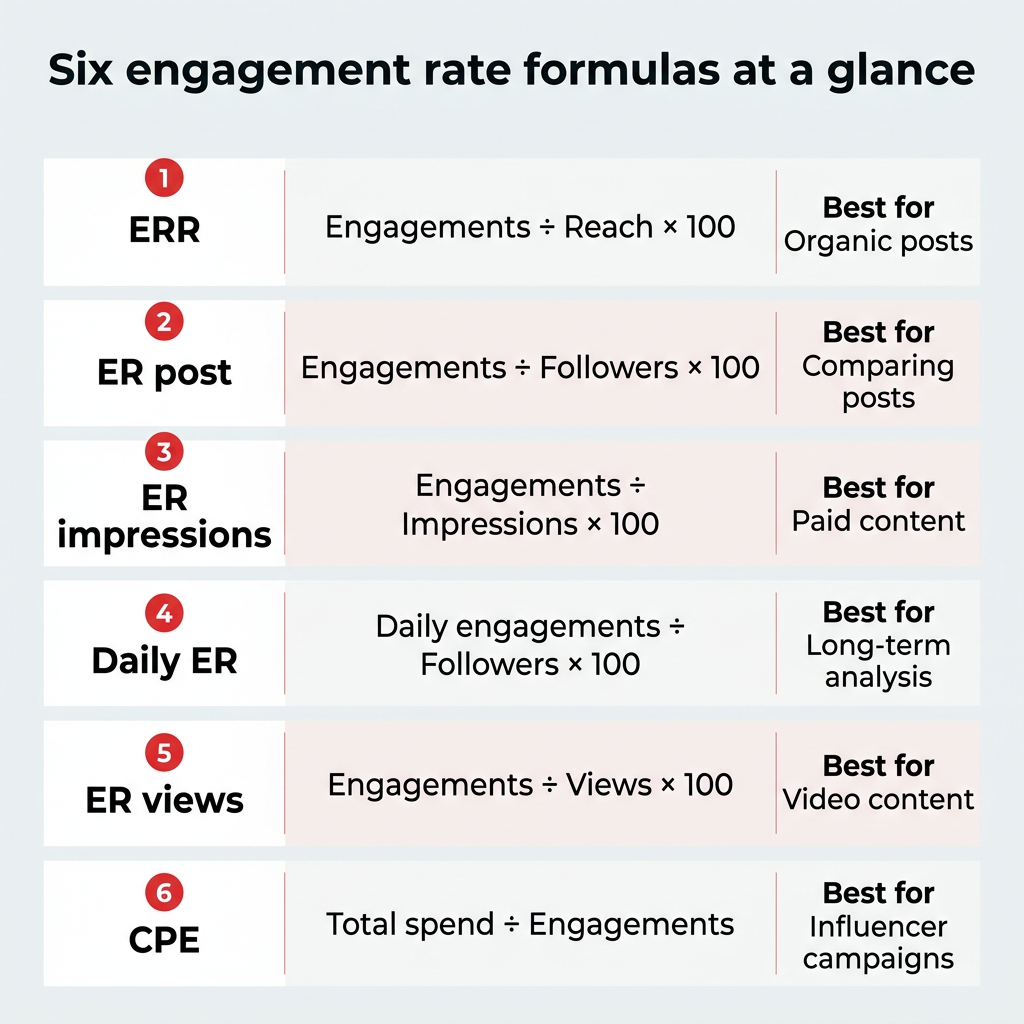
1. Engagement Rate by Reach (ERR)
The Industry Default
Formula: (Total Engagements / Total Reach) * 100
ERR is the most accurate metric for organic content because it accounts for the reality that your followers are not the only ones seeing your posts. By using "Reach" as the denominator, you measure how effective your content is with the people who actually saw it.
2. Engagement Rate by Post (ER Post)
The Comparative Standard
Formula: (Total Engagements / Total Followers) * 100
This is the standard for influencers and brand accounts that want a stable, consistent baseline to compare how different posts perform relative to their total audience size.
3. Engagement Rate by Impressions (ER Impressions)
The Paid Media Metric
Formula: (Total Engagements / Total Impressions) * 100
Ideal for paid advertising campaigns where the same user might see a post multiple times. It helps marketers understand the efficiency of their ad spend relative to the number of times a creative asset was served.

4. Daily Engagement Rate (Daily ER)
The Long-Term Health Metric
Formula: (Total Engagements in a Day / Total Followers) * 100
This captures the overall "pulse" of your account, including interactions on older posts. It is the best way to monitor long-term community health.
5. Engagement Rate by Views (ER Views)
The Video Specialist
Formula: (Total Engagements / Total Video Views) * 100
Essential for TikTok, Reels, and YouTube Shorts, where "views" are the primary volume metric.
6. Cost Per Engagement (CPE)
The Financial Efficiency Metric
Formula: Total Amount Spent / Total Engagements
This is vital for finance teams to calculate the exact monetary cost of generating a single interaction, making it the primary metric for ROI-focused influencer campaigns.
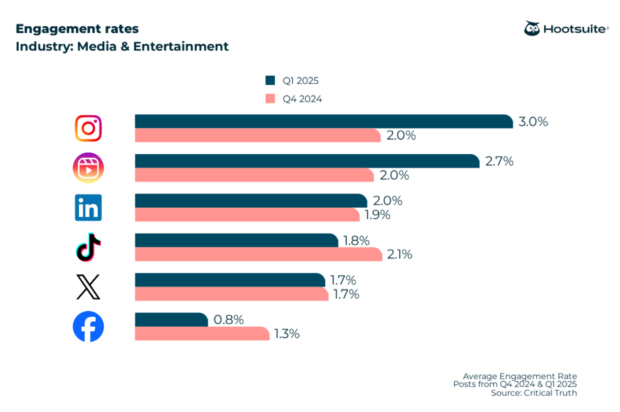
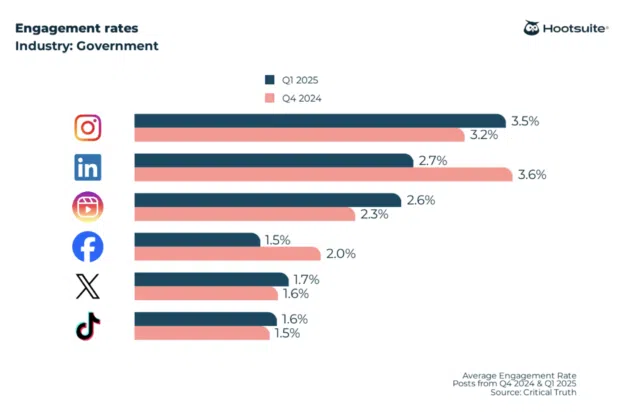
Supporting Data: 2026 Industry Benchmarks
In collaboration with data science experts at Critical Truth, Hootsuite has analyzed over one million social media posts to provide the following benchmarks. These figures serve as a baseline for 2026 performance:
| Platform | Avg. Engagement Rate (All Industries) |
|---|---|
| 3.0% | |
| Instagram Reels | 2.7% |
| 2.0% | |
| X (Twitter) | 1.8% |
| TikTok | 1.5% |
| 0.8% |
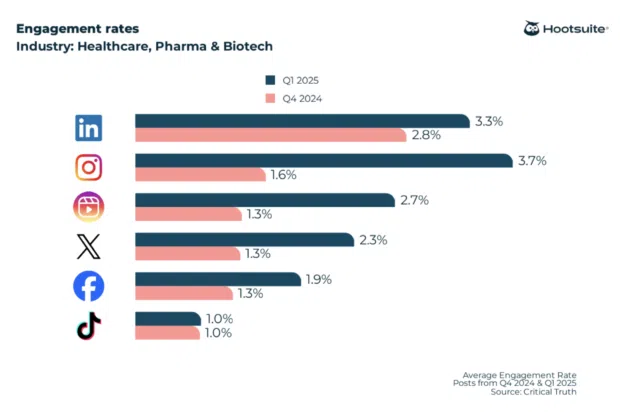
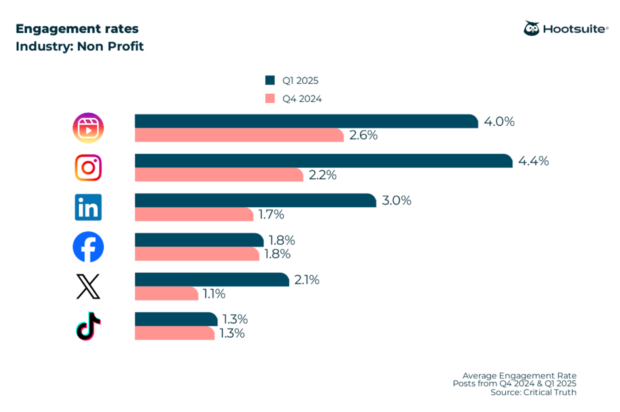
Industry-Specific Nuances
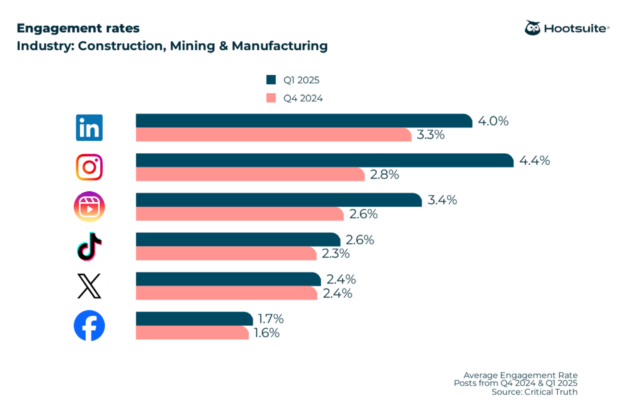
- Construction & Manufacturing: Instagram leads the charge here with an impressive 4.4% engagement rate, proving that visual storytelling works even in "boring" B2B sectors.
- Nonprofit: Similarly, nonprofits see a 4.4% engagement rate on Instagram, driven by mission-based emotional storytelling.
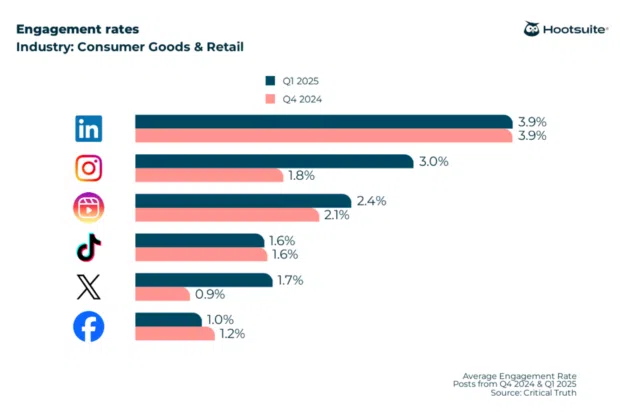
- Consumer Goods & Retail: LinkedIn is a surprise leader in this sector at 3.9%, highlighting the power of professional networking for retail brand authority.
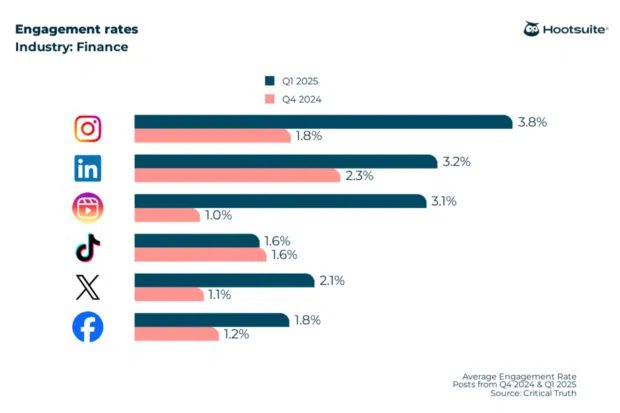
- Finance: Instagram remains the strongest performer at 3.8%, as financial brands pivot toward educational, short-form video content to build trust.
Implications: Moving Beyond the Numbers
Calculating these metrics is only the first step. The real strategic value lies in how you apply these insights.
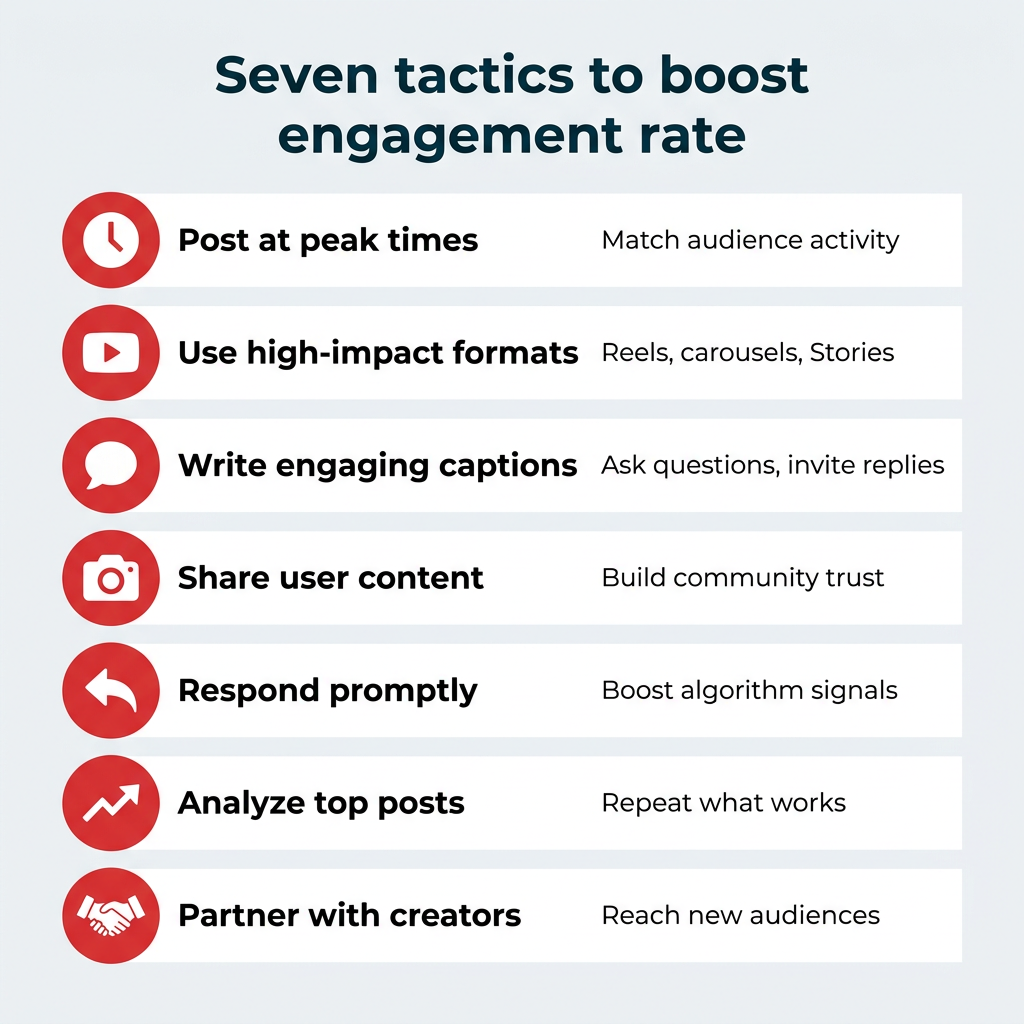
1. The "Audit and Pivot" Strategy
If your engagement rate is consistently below the industry benchmark, don’t panic. Instead, use your data to identify the "format gap." Are your image-based posts performing worse than your carousels? If so, shift your content calendar to favor the higher-performing format.
2. Algorithmic Alignment
Social algorithms favor "high-velocity" engagement. When you post at times when your audience is most active (a feature easily tracked by analytics tools like Hootsuite), you increase the likelihood of early interaction, which triggers the algorithm to push your content further.
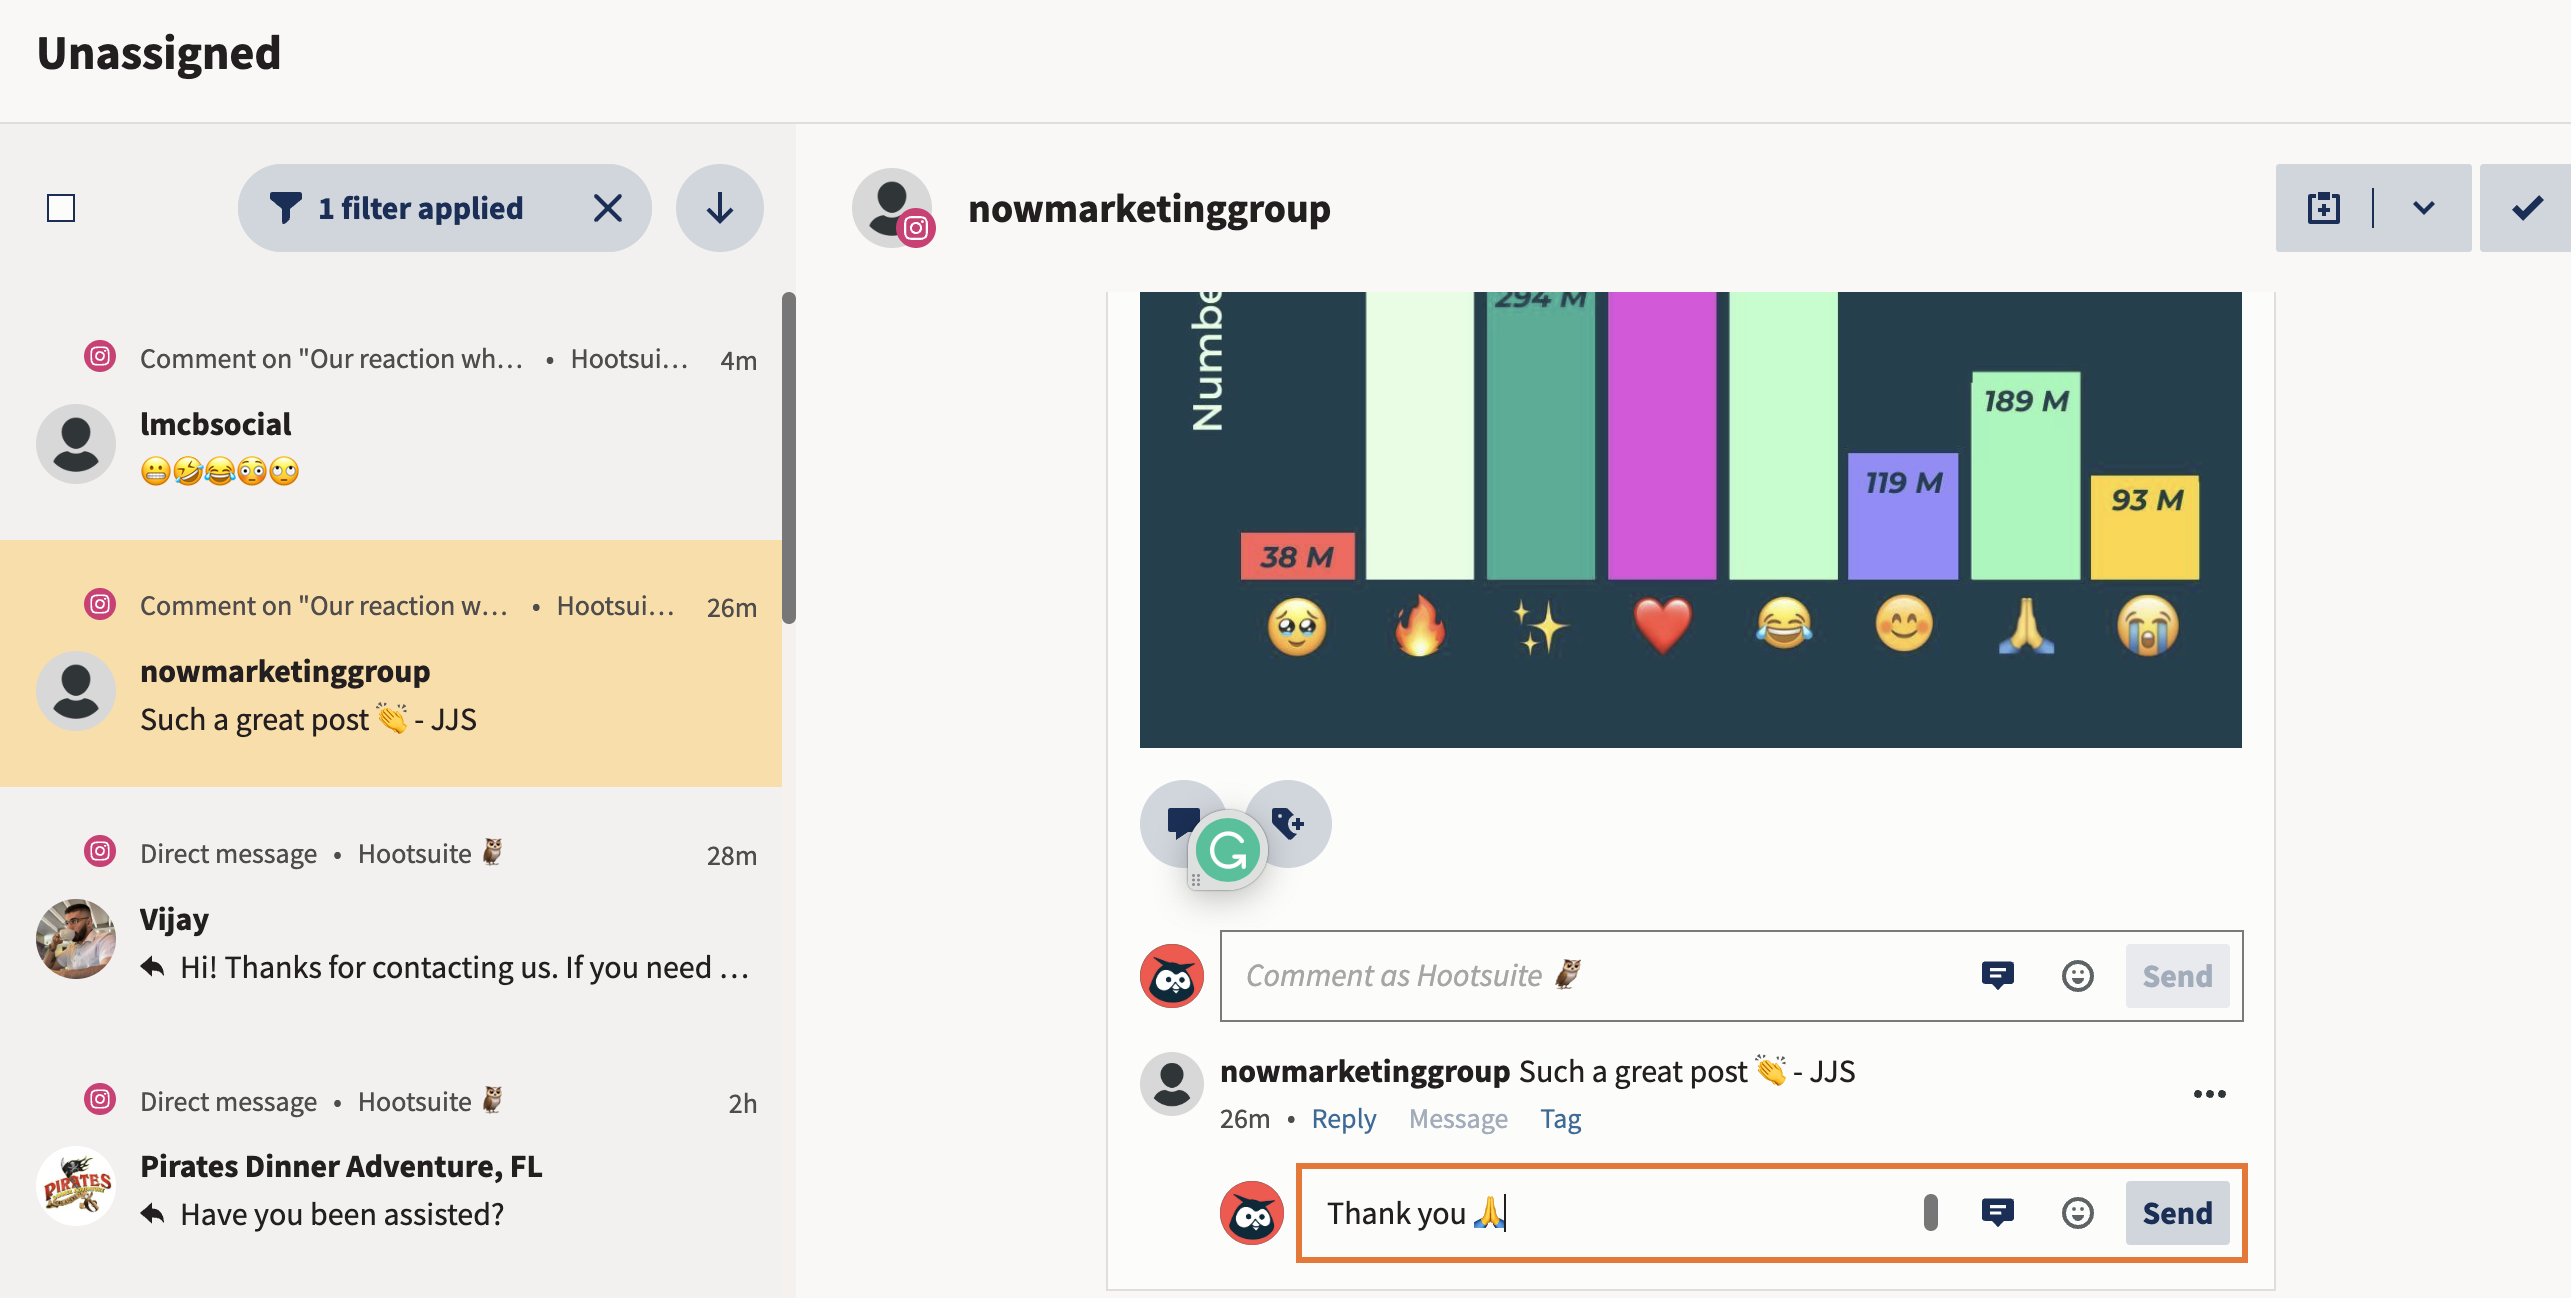
3. Community Management as Content
Often, the best way to improve engagement is to respond to it. By replying to comments and initiating conversations, you turn a one-way broadcast into a two-way dialogue. This "comment-back" strategy often leads to a measurable increase in long-term follower loyalty.
Expert Insights: The Future of Engagement
The consensus among digital marketing experts is clear: the focus for the remainder of 2026 and beyond will be on "Deep Engagement."

"We are seeing a move away from the ‘easy’ engagement of a simple like," notes Christina Newberry, a veteran of digital marketing strategy. "Brands that are seeing the highest growth are those that prioritize ‘Saves’ and ‘Shares.’ These actions signal that your content is either highly educational or deeply relatable—two traits that are rewarded heavily by modern platform algorithms."
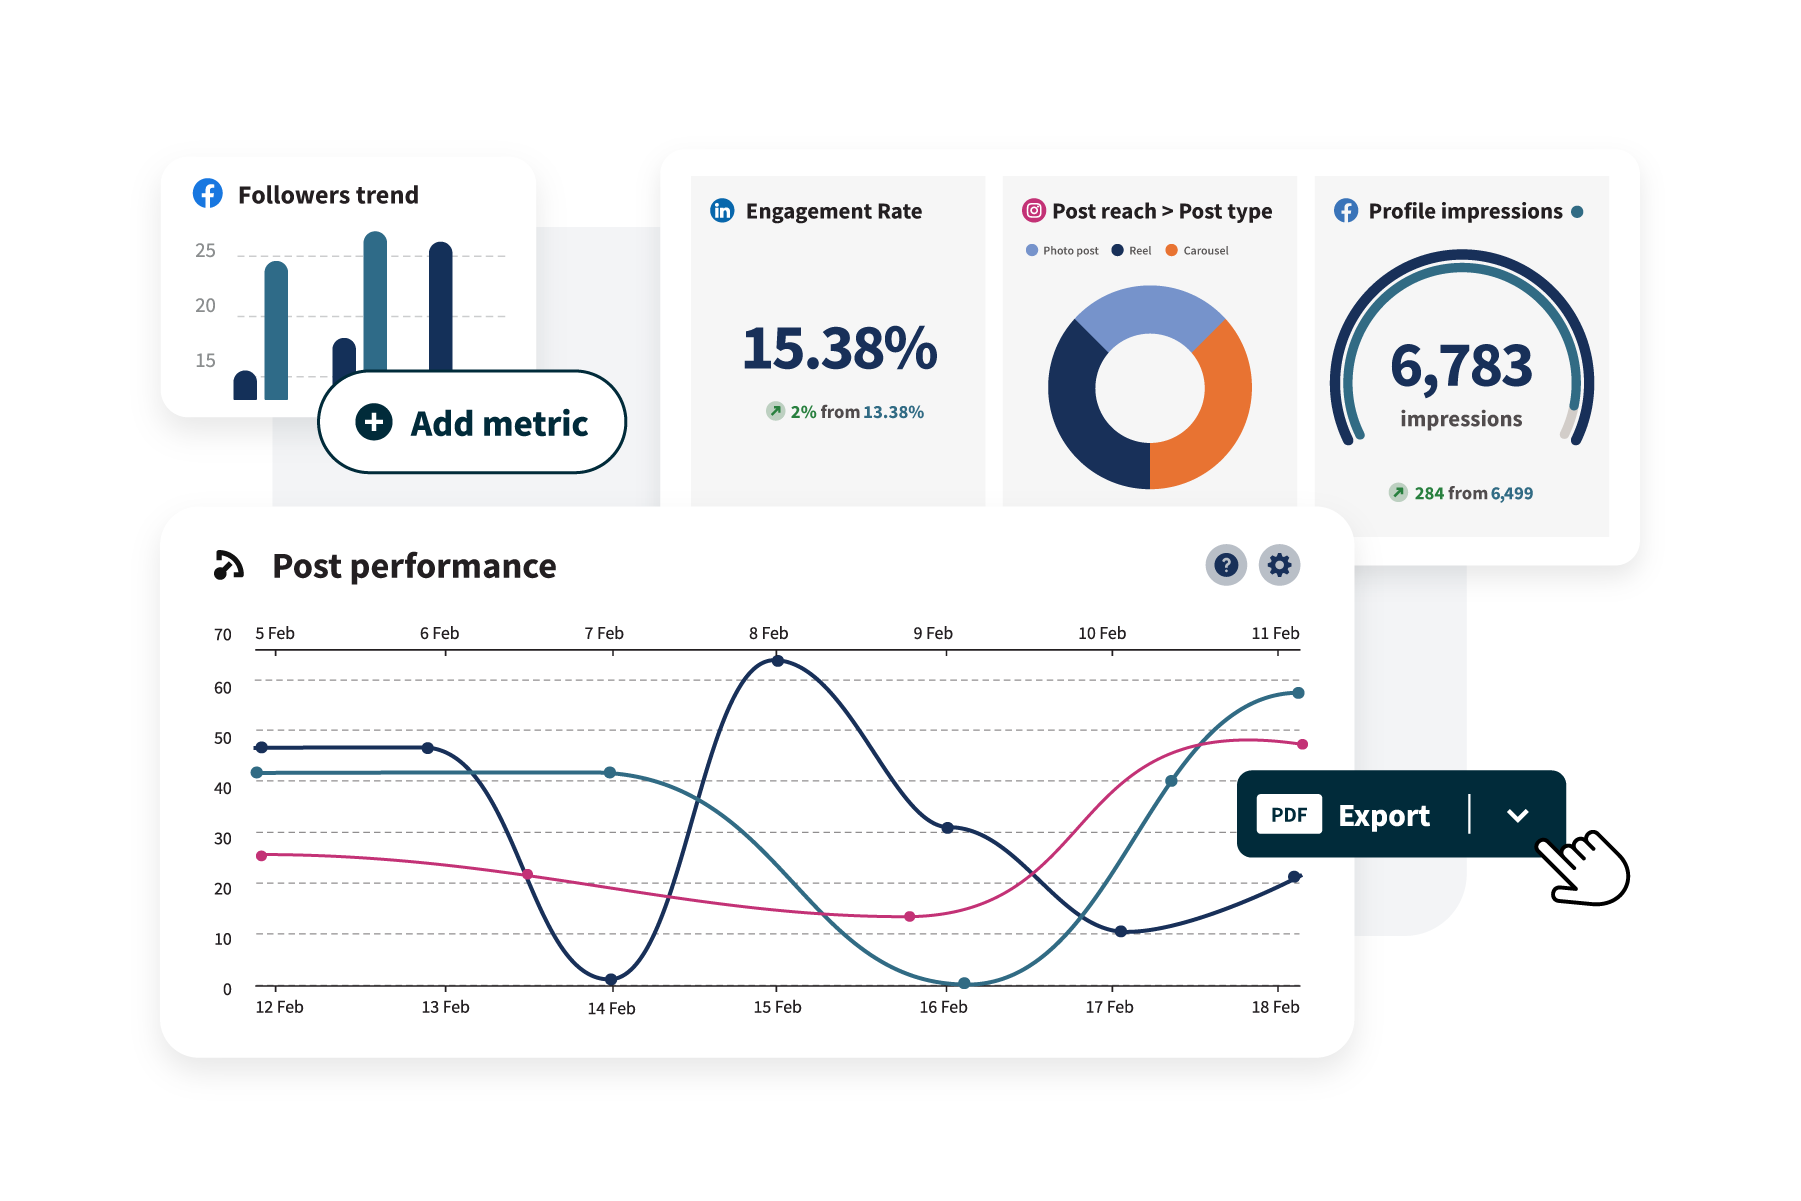
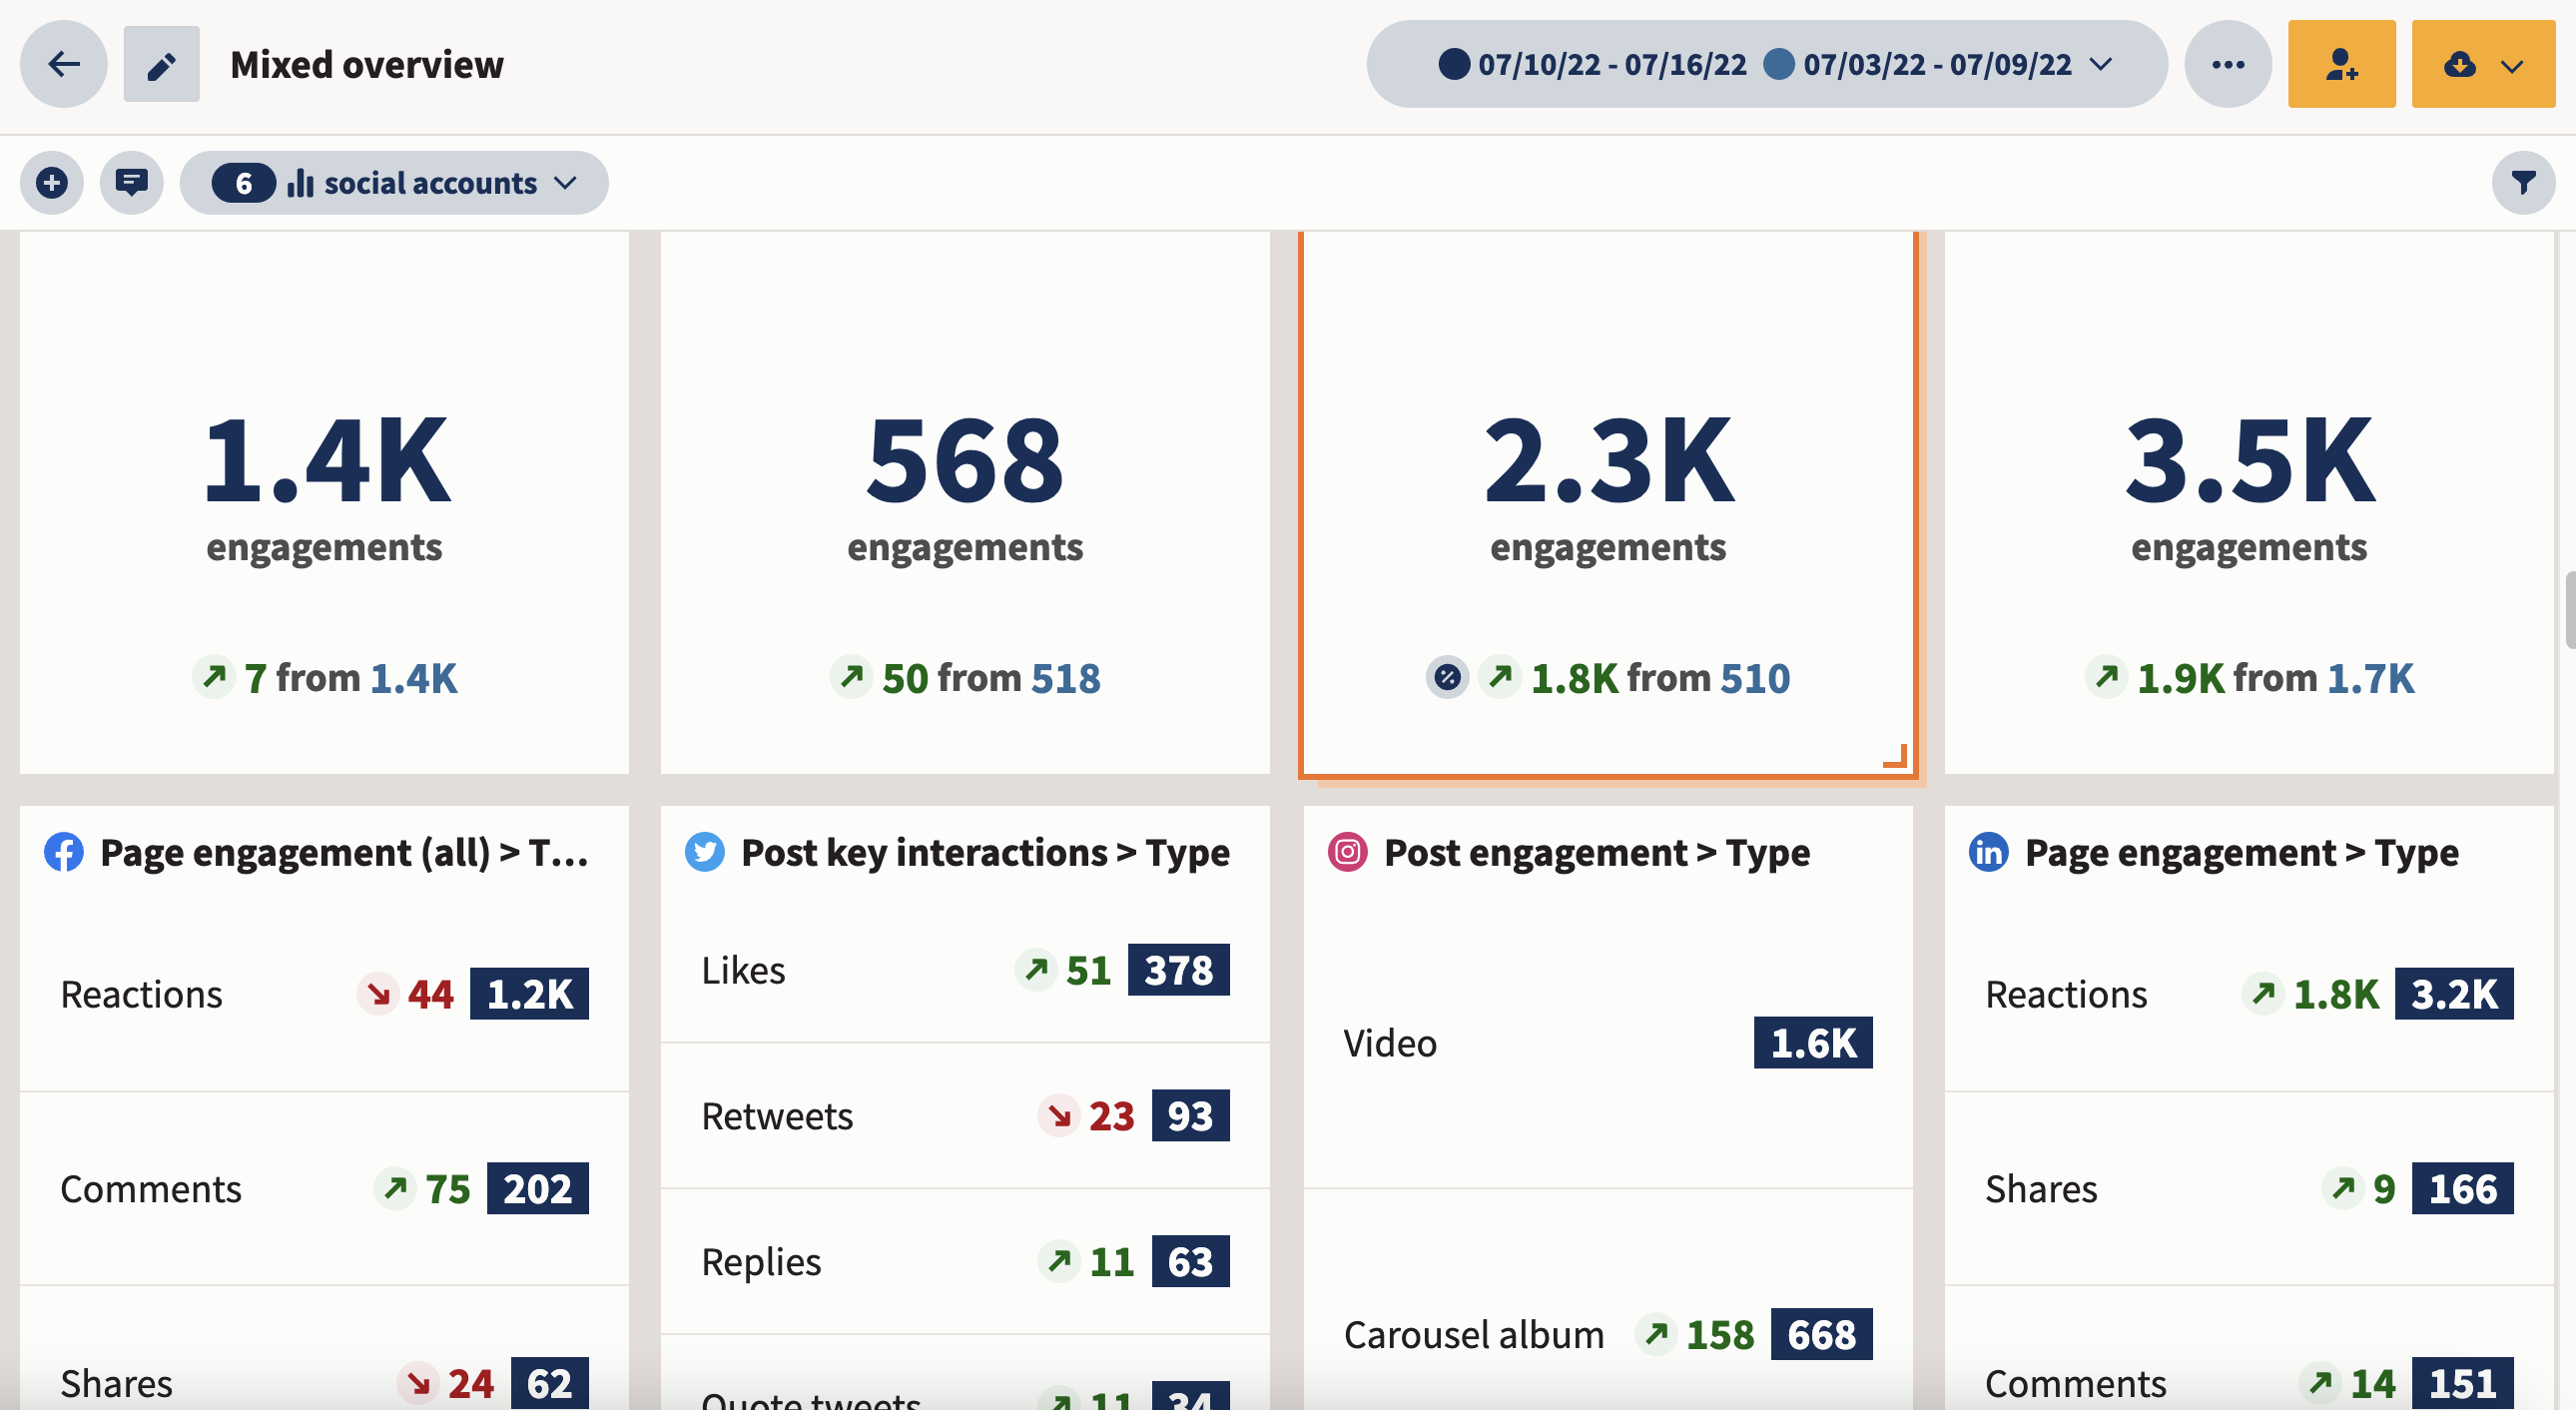
For enterprise teams, the solution lies in automation. Managing these metrics manually across five or six different platforms is a recipe for error. Utilizing integrated analytics dashboards allows for a unified view of performance, enabling teams to spend less time calculating in spreadsheets and more time crafting the creative strategies that drive these numbers upward.
Conclusion
Engagement rate is not just a number on a report; it is a direct reflection of how much value your audience places on your brand’s presence in their digital lives. By understanding the nuance between different formulas, comparing your results against reliable 2026 industry benchmarks, and consistently refining your content strategy based on data, you can build a social media presence that is not only visible but truly influential.

Remember: A 1% to 5% engagement rate is the gold standard. If your brand falls within this range, you are effectively cutting through the noise. If you fall below, the data is your roadmap to improvement—study the peaks, learn from the valleys, and keep testing.