
It is the 28th of the month. You are managing twelve clients. You have just finished the fourth one.
You have logged into Meta, pulled the raw numbers, navigated to Instagram Insights, repeated the process for LinkedIn, manually copied every data point into a rigid spreadsheet, and are now performing the "ritual of formatting"—adjusting margins on a slide deck you built in 2023, promising yourself you will redesign it "next quarter." Three hours have vanished. Eight clients remain.
For many social media managers, this cycle is the "end-of-month tax." At twelve clients, this process consumes between 18 and 24 hours every month—more than half a standard work week. Yet, the end result is often a document the client skims for three minutes before sending a perfunctory reply: "Looks good."
This is not a time management problem; it is a structural failure. In an era where agency owners are obsessed with scaling, the most significant barrier to growth is often the very manual reporting process they believe is "keeping the client happy."
The Chronology of an Efficiency Collapse
To understand why agencies struggle to scale, one must look at the typical lifecycle of a reporting cycle.
- The Data Retrieval Phase (Days 25-28): The manager spends the final week of the month manually exporting CSV files from multiple platforms. This is error-prone, tedious, and adds zero strategic value.
- The Transformation Phase (Days 28-30): Data is cleaned, pivoted, and pasted into static presentation templates. Because the data is not dynamic, any change in platform API metrics requires a manual overhaul of the slide deck.
- The Distribution Phase (Day 1 of the following month): Emails are sent individually to clients. Often, this is when the "invisible" work begins—answering questions that should have been clarified in the report itself.
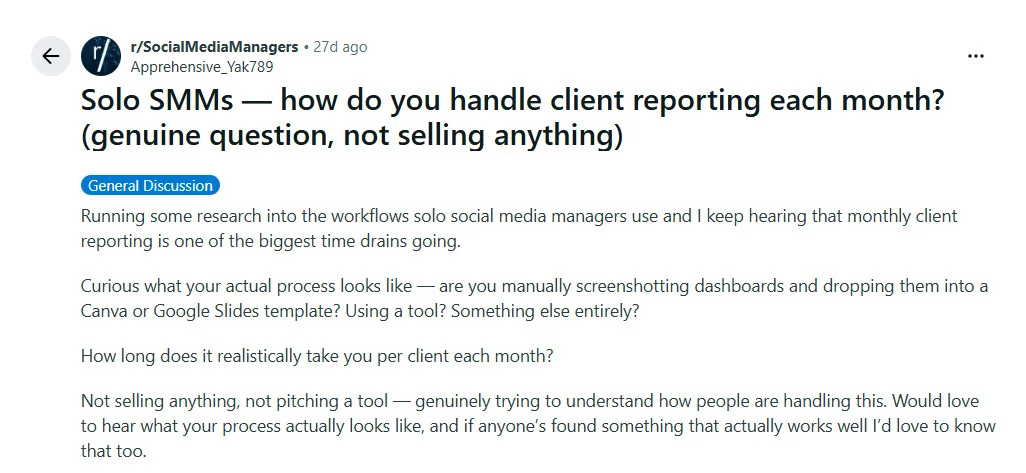
As one agency owner noted on the r/SocialMediaManagers Reddit thread, the frustration is universal: "I spend more time making the numbers look pretty than I do actually analyzing what those numbers mean for my client’s bottom line."
Supporting Data: Outputs vs. Outcomes
The fundamental flaw in modern agency reporting is the confusion between "outputs" and "outcomes."
Most agencies provide a laundry list of vanity metrics: total follower counts, raw impressions, and post volume. These metrics show that the agency is "working hard." However, clients do not pay retainers for hard work; they pay for business growth.
The Shift: Measuring What Matters
| Report This (Outcome) | Not This (Output) |
|---|---|
| Follower growth rate (% change) | Total follower count |
| Engagement rate relative to reach | Raw likes and comments |
| Reach by platform | Total impressions |
| Top 3 posts with strategic context | Full post log |
| Link clicks and UTM-tracked traffic | Video views without context |
| Period-over-period comparison | Single-month snapshot |
| Progress against agreed-upon goals | Metrics not tied to business objectives |
The data confirms that when reports are cluttered with irrelevant metrics, clients experience "data fatigue." They stop reading, stop engaging with the findings, and eventually, the report loses its value as a tool for retention.
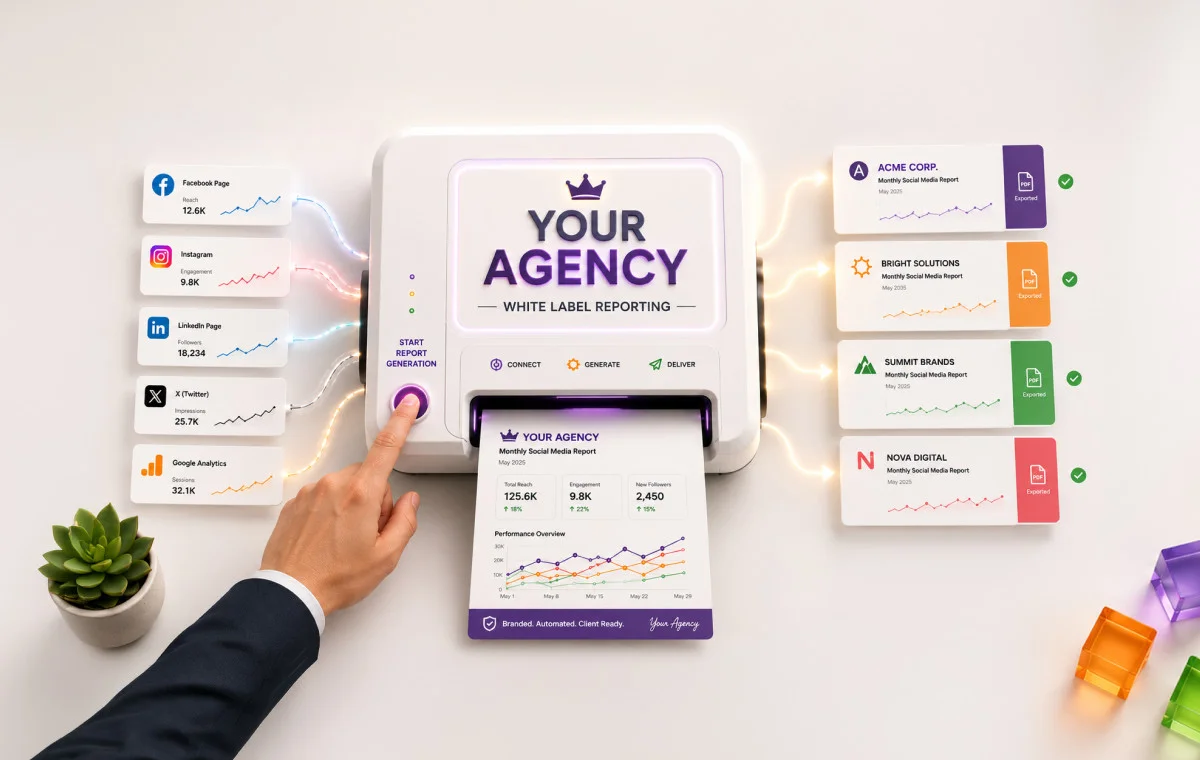
The Professional Implication: The "White Label" Effect
There is a psychological component to reporting that is frequently overlooked: the report is a first impression every single month.
When a client opens a PDF and sees a third-party tool’s watermark or a generic spreadsheet export, they are subconsciously reminded that they are working with a provider who lacks a proprietary system. It suggests a lack of scale and professional infrastructure.
White labeling is the industry standard for firms that want to present a unified brand identity. By removing the "Powered by" labels and replacing them with the agency’s own logo, color palette, and custom domain, the agency shifts the narrative from "user of software" to "expert partner."
Cost-Benefit Analysis of Modern Reporting Tools
Transitioning to an automated, white-labeled system is an investment, but the alternative—the cost of manual labor—is significantly higher.
| Tool | White Label Starting Point | Estimated Starting Price |
|---|---|---|
| SocialPilot | Premium Plan | $85/mo |
| DashThis | Professional (10 Dashboards) | $159/mo |
| AgencyAnalytics | Agency Plan | $239/mo |
| Sendible | Dedicated White Label Plan | $240/mo |
The data suggests that platforms like SocialPilot provide a more accessible entry point for scaling, allowing agencies to automate delivery without the prohibitive cost of enterprise-tier subscriptions.
Official Perspectives: The Experts Speak
Industry leaders are increasingly calling for the "death of the manual report." The consensus among growth consultants is that if a report takes more than five minutes to generate, the system is broken.
"The goal of a report is to facilitate a conversation, not to document the past," says one industry analyst. "If you are spending 20 hours a month building reports, you are spending 20 hours a month doing work that should be handled by an API."
The implications are clear: Agencies that refuse to automate their reporting will eventually be outpriced by competitors who have lower overhead and higher capacity for client communication.
Implementing the System: A Four-Step Framework
For the agency owner ready to reclaim their Fridays, the transition to automated reporting can be completed in a single afternoon.
1. Define the Brand Identity
The first step is establishing a consistent visual language. Within a white-label interface, you must upload your agency’s logo, select your brand colors, and ensure that every asset—from the PDF cover page to the email notification—matches your professional identity.
2. Establish the Domain and Email Sender
The report should arrive from your domain, not a generic "[email protected]" address. By configuring your DNS settings to allow for branded email delivery, you ensure that the client’s inbox recognizes your agency as the primary source of truth.
3. Build Reusable Templates
Stop rebuilding the wheel. Create three master templates based on client archetypes:
- The E-commerce Template: Focuses on conversion, ROAS, and UTM-tracked traffic.
- The B2B Template: Focuses on lead generation, thought leadership reach, and engagement quality.
- The Local Business Template: Focuses on community growth and localized reach.
4. Automate the Delivery Loop
Once the templates are set, the final step is scheduling. By linking the client’s social accounts to an automated reporting tool, you can set the "delivery date" for the first of the month. The system pulls the live data, applies the template, attaches the branded PDF, and sends it directly to the client’s inbox.
The Bottom Line: Does Your Reporting Prove Value?
The ultimate question for every social media manager is this: Does your current process prove the value of your work, or does it merely document it?
If you are currently spending your end-of-month hours copy-pasting numbers into a spreadsheet, you are treating your business like a hobby. Scaling requires infrastructure. By moving to a white-labeled, automated reporting system, you aren’t just saving 20 hours a month—you are upgrading your professional stature.
The version of you that has Fridays back is not a myth; it is the version of you that decided to stop being a data-entry clerk and started being a data-driven strategist.
The software exists. The templates are ready. The only remaining hurdle is the decision to stop doing the work manually and start building the infrastructure that your agency deserves. For those ready to make the switch, platforms like SocialPilot offer the tools to turn a monthly chore into a seamless, high-value client touchpoint.
Your clients aren’t paying for your time; they are paying for your insight. It’s time to spend your hours on the latter.