In the rapidly shifting landscape of digital marketing, Instagram remains a cornerstone for brand visibility and customer acquisition. However, as the platform’s algorithm grows increasingly sophisticated, the sheer volume of available data can paralyze even the most seasoned social media managers. In 2026, the question is no longer "what can we track," but "what actually matters?"
Moving beyond superficial "vanity metrics"—such as raw follower counts or simple like tallies—is essential for any business aiming to prove return on investment (ROI). To truly gauge success, brands must pivot toward actionable insights that correlate directly with business KPIs.

The Evolution of Instagram Analytics
Historically, Instagram marketing was a game of accumulation. Brands measured success by how quickly they could swell their follower lists. By 2026, the paradigm has shifted toward depth over breadth. Today’s analytics tools allow for granular tracking that connects a casual scroll on a mobile screen to a purchase on an e-commerce backend.
This shift is largely driven by the platform’s focus on intent-based content. With the rise of Reels and integrated shopping features, Instagram has evolved from a digital photo album into a high-octane sales funnel. Consequently, the metrics that matter are those that signal intent: shares, link taps, and community-driven engagement.

The 9 Critical Metrics for 2026
To maintain a competitive edge, marketing teams should prioritize the following nine metrics, categorized by their function in the marketing funnel.
1. Follower Growth Rate
While total followers may be a vanity metric, the growth rate is a vital health indicator. It measures how effectively your content strategy attracts new, relevant eyes.
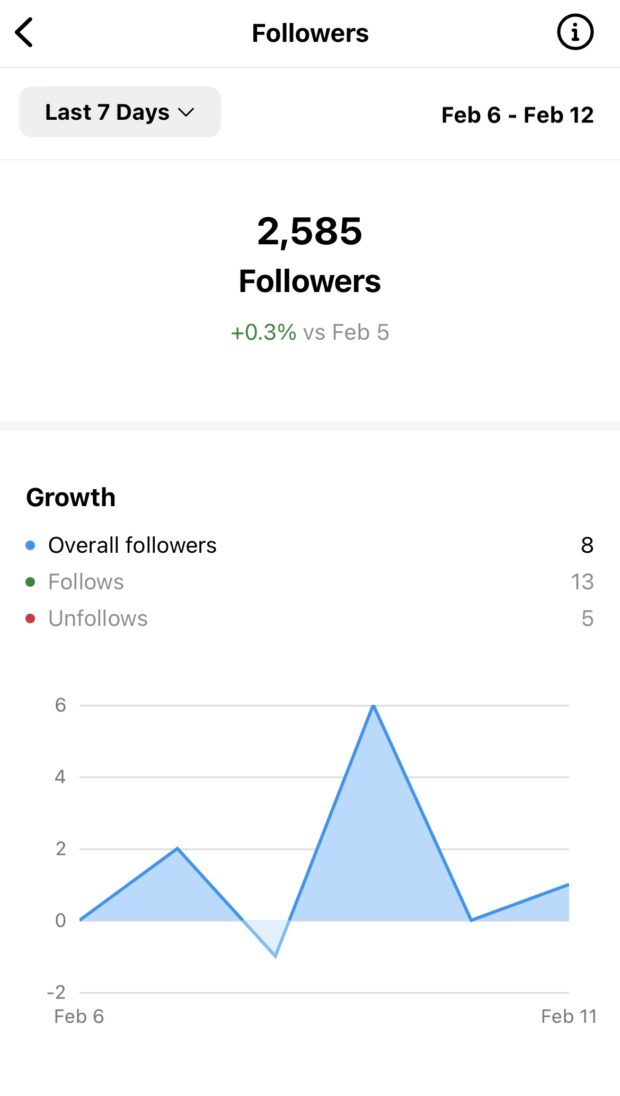
- The Benchmark: A healthy growth rate for most industries currently sits between 1% and 2%.
- Strategic Value: If this number stalls, it is a red flag that your content is no longer reaching beyond your existing echo chamber.
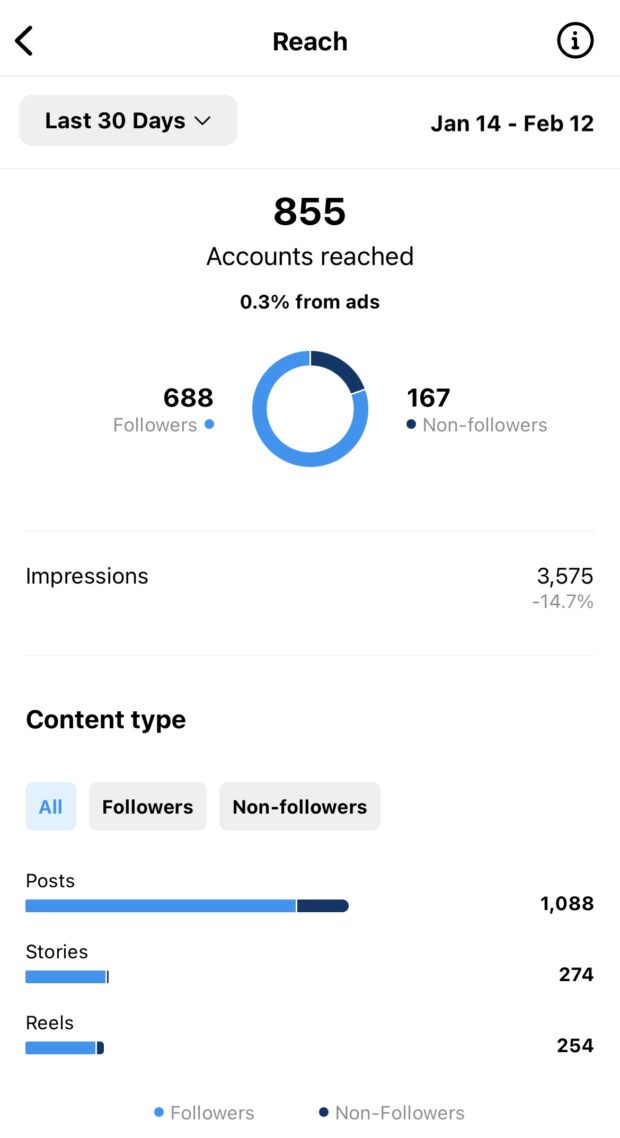
2. Reach and Reach Rate
Reach measures unique users, filtering out the noise of repeated views. While "impressions" tell you how many times a post was loaded, "reach" tells you how many actual human beings were exposed to your brand.
- The Benchmark: Aim for a 12% reach rate on feed posts and roughly 2% for Stories.
3. Reel Shares
In the current algorithm, the "Share" button is the highest form of endorsement. A share indicates that your content was valuable enough for a user to stake their own social reputation on it.
- The Logic: Shares exponentially increase your reach, effectively bypassing the constraints of your own follower count to tap into the networks of others.
4. Engagements by Follower
This metric tracks the loyalty of your existing base. By dividing total interactions by total followers, you can see if your current audience is actually invested in your narrative.
- The Benchmark: 1–3% is standard, but 5% or higher is considered a "high-performance" threshold.
5. Engagement by Reach
This provides a measure of content quality. It tells you, of the people who saw your post, what percentage felt compelled to act. This is the ultimate test of your creative strategy.

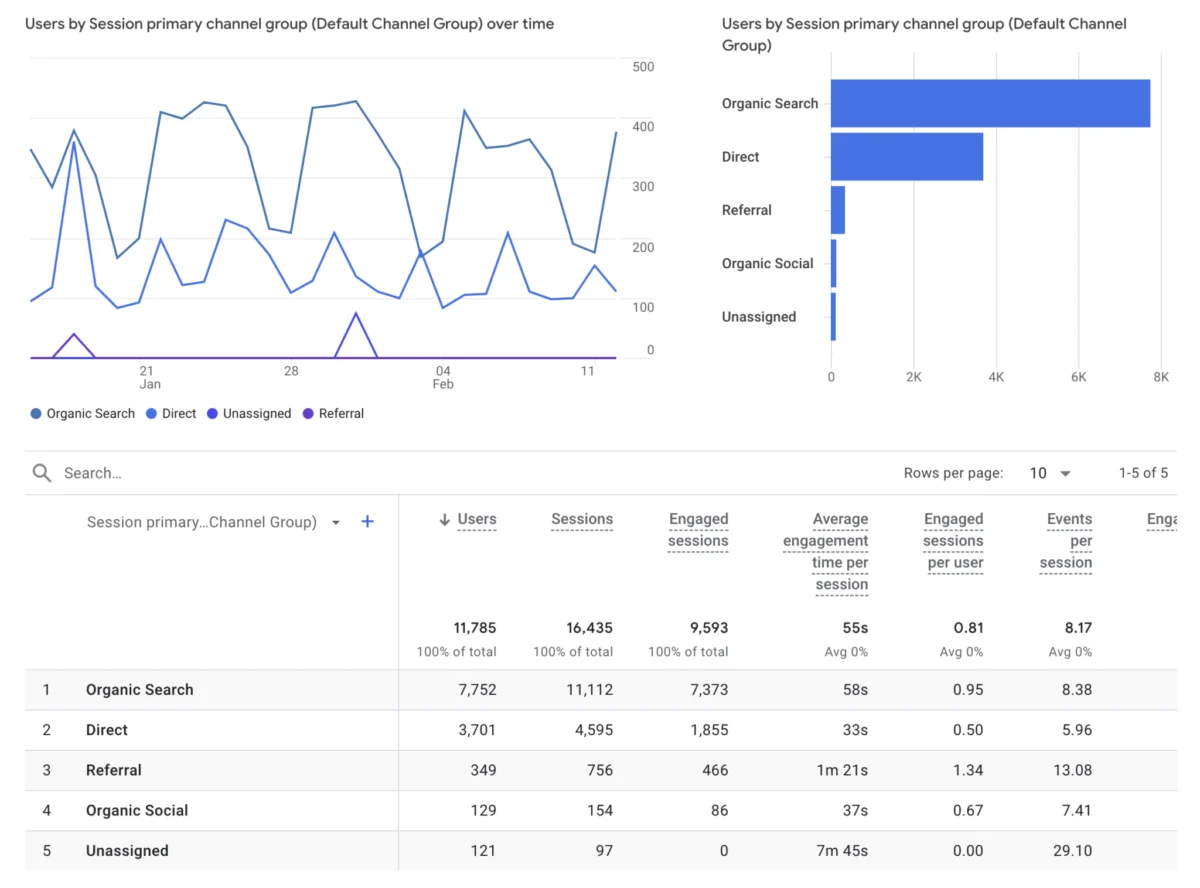
6. Website Traffic
Social media is rarely the final destination; it is the bridge. Tracking how many users click through to your website is essential for calculating the conversion value of your Instagram efforts.
7. External Link Taps (Posts)
With the introduction of more robust in-post analytics, brands can now see how many users click through on specific promotional assets. This allows for A/B testing: does a lifestyle shot or a direct product preview drive more traffic?

8. Link Clicks (Stories)
Stories remain the most intimate way to communicate with followers. Tracking the effectiveness of your "Link" stickers allows you to measure how many users are moving from a passive viewer state to an active consumer state.
9. The "North Star" Metric (NSM)
Beyond standard KPIs, every brand needs a "North Star." This is a singular metric that ties directly to your company’s core mission. For Patagonia, it might be carbon reduction; for a fitness app, it might be "total miles logged by users." Your NSM should be the metric that, if increased, proves you are fulfilling your brand’s promise.
Data Integration: Connecting the Dots
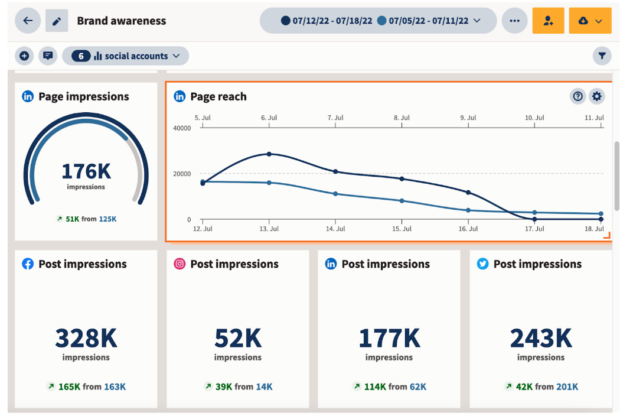
The true power of these metrics lies in their aggregation. Using third-party tools like Hootsuite, teams can centralize data from Instagram, LinkedIn, TikTok, and web analytics. This allows for a "cross-channel" view of the customer journey.
For instance, an enterprise brand might notice that a specific type of Reel correlates with a spike in website traffic, which then correlates with a rise in sales three days later. Without centralized analytics, these dots remain unconnected.

The Role of Industry Benchmarks
It is dangerous to view these metrics in a vacuum. A 2% engagement rate might be disastrous for a boutique fashion brand but an incredible success for a global logistics company.
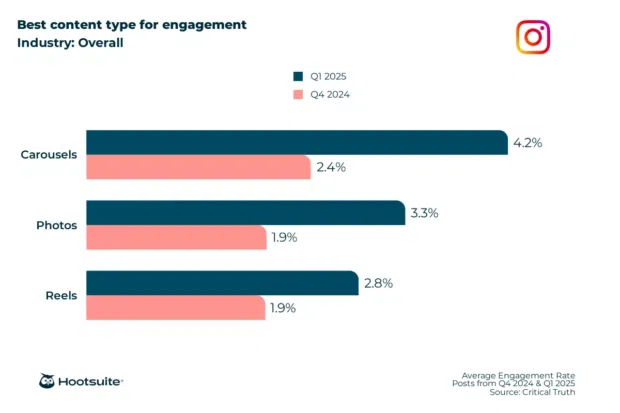
- Content Type Disparities: Data consistently shows that carousels often yield higher engagement (approx. 4.2%) than static photos (3.3%) or Reels (2.8%).
- Contextualizing: When reporting to stakeholders, always normalize your data against your specific industry averages rather than generic platform-wide averages.
Implications for Future Strategy
As we move further into 2026, the implication for social media managers is clear: stop reporting on vanity.
Shift from: "We gained 500 followers this month."
Shift to: "Our follower growth rate remained steady at 1.5%, while our conversion rate from Story links increased by 8%, suggesting that our new product-focused content is successfully moving followers into the sales funnel."
This pivot in communication changes the social media team’s standing within a company. It transforms the department from a "cost center" focused on likes to a "revenue driver" focused on measurable business outcomes.

Conclusion: The Path Forward
The metrics outlined in this guide are not just numbers; they are the feedback loop of your brand’s digital existence. By identifying your North Star, focusing on reach-based engagement, and rigorously tracking the path from social post to website conversion, you turn Instagram from a black box into a predictable engine of growth.
The goal for 2026 is not to be the account with the most followers, but the account with the most influence over the people who matter most to your business. Start by auditing your current reporting structure—if a metric doesn’t help you make a decision, it’s time to stop tracking it.